Version 2.4.2 of Q247 introduces SCIM integration — automatic synchronization of users and teams from identity providers (Okta, Microsoft Entra ID, Google Workspace, and others compliant with SCIM 2.0), with optional control of the ADMIN role and login access on the IdP side. This release also brings detection of cherry-pick, rebase, and revert in repository history with the ability to exclude them from metrics, and a new presentation of the "Others" group in participant tables with an option to copy the list of people. The remaining changes are a series of improvements aimed at making tables and charts, data source configuration, and login screens easier to use, as well as boosting the performance of the Participant view in large organizations.
Below you will find a detailed description of the most important changes.
New Features
SCIM Provisioning — Identity Provider Integration
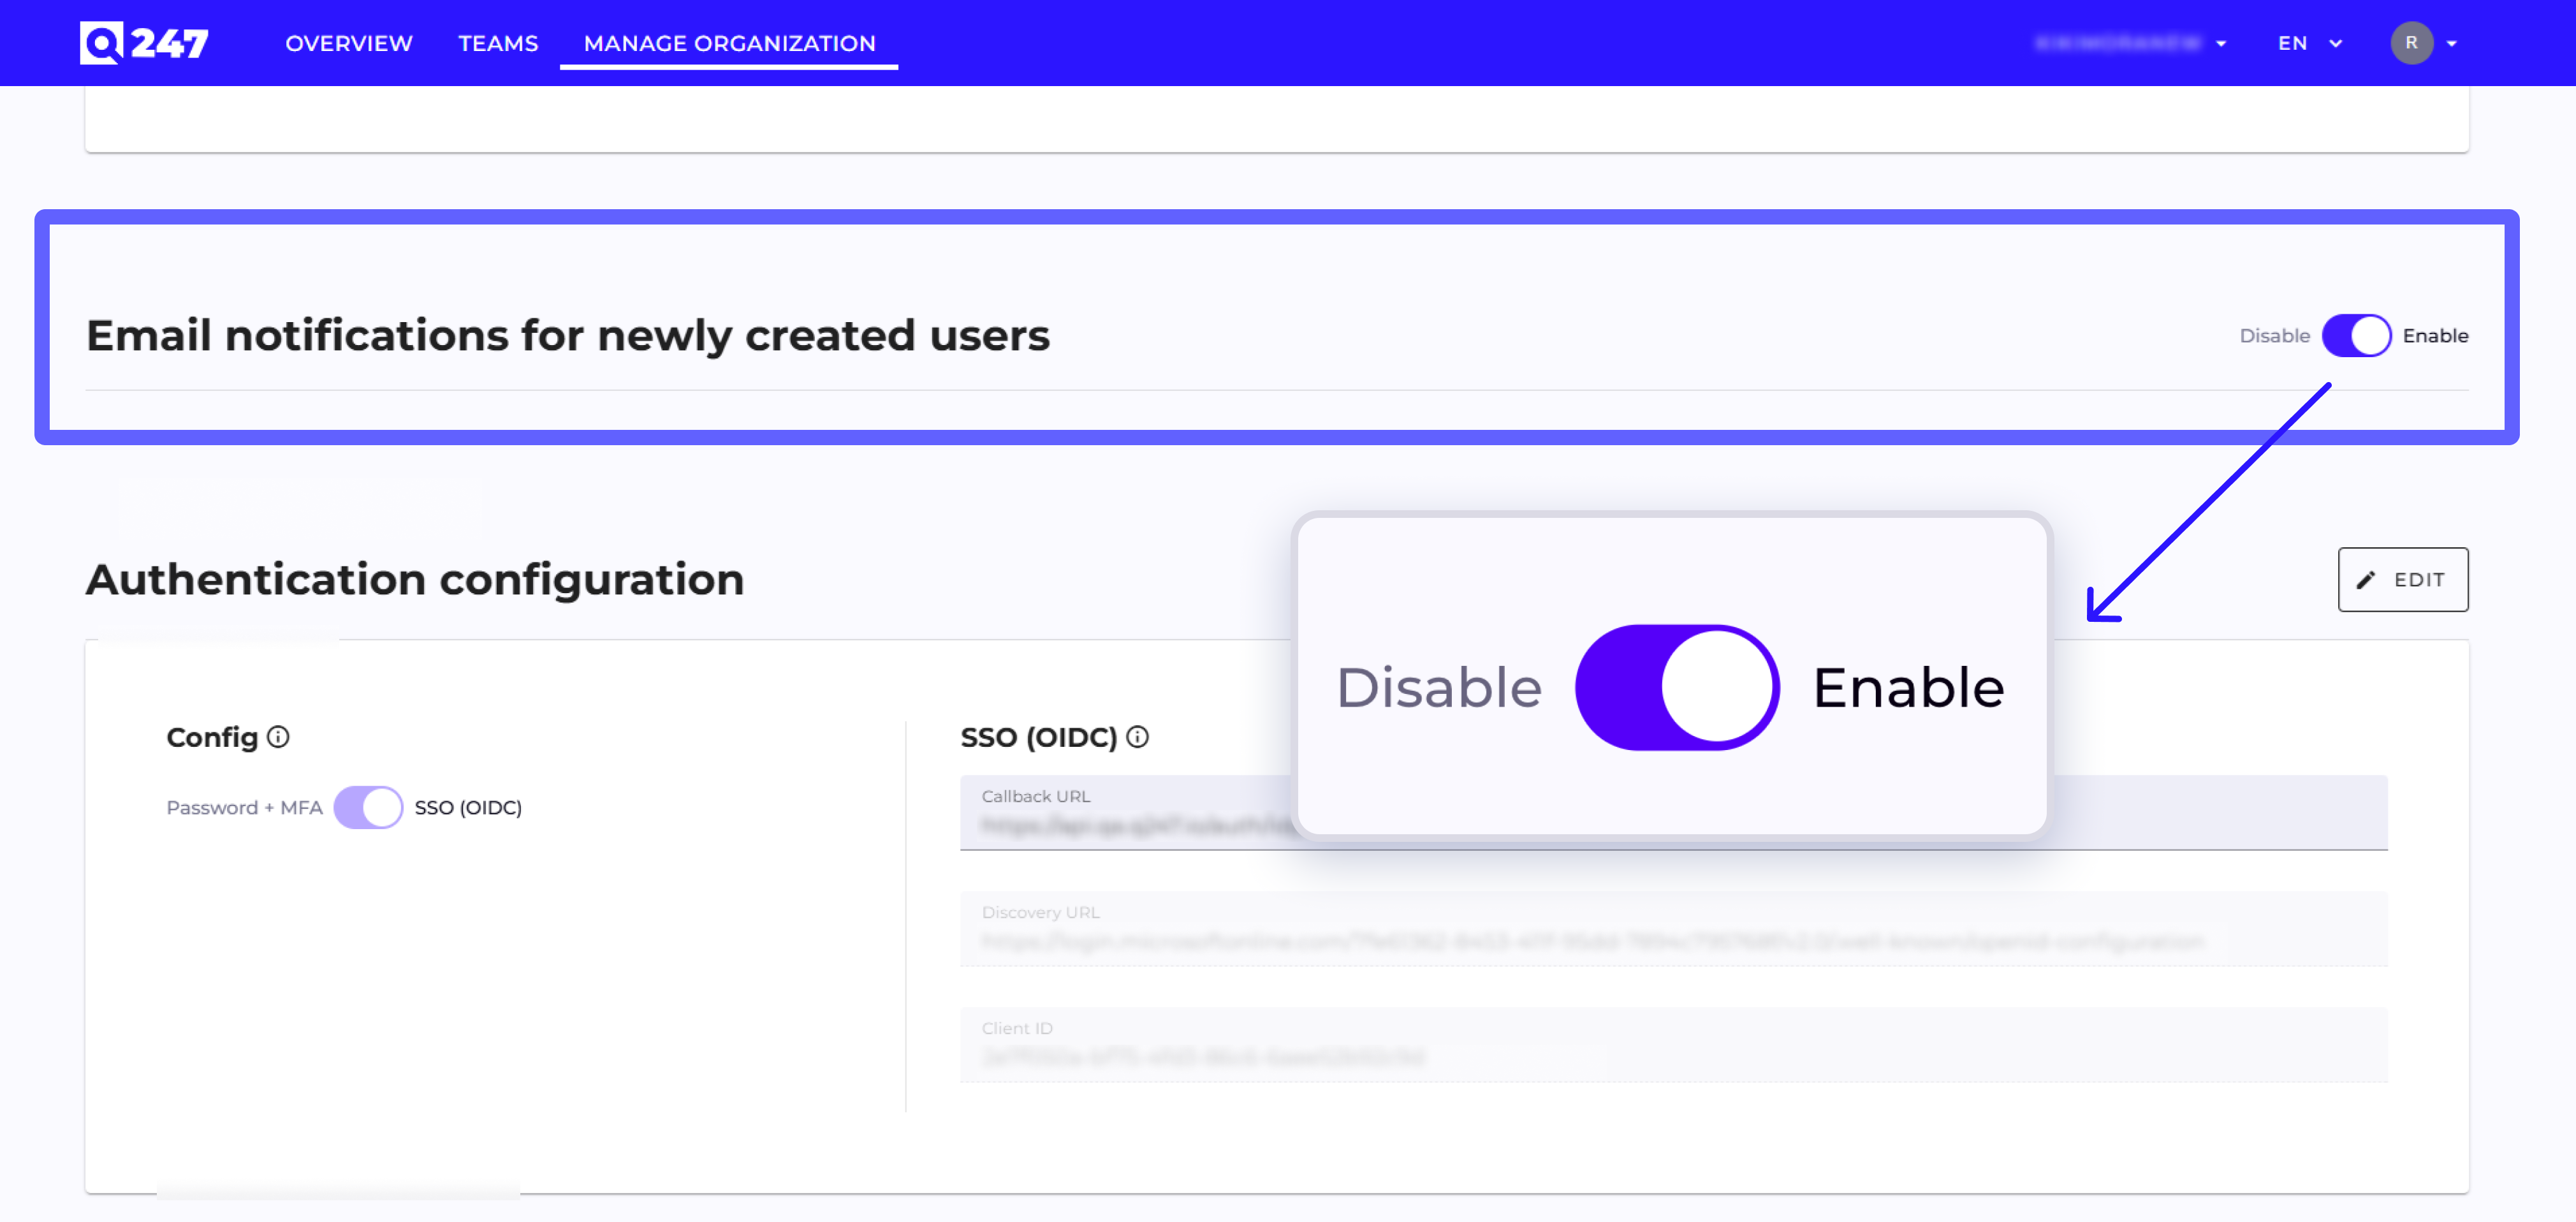
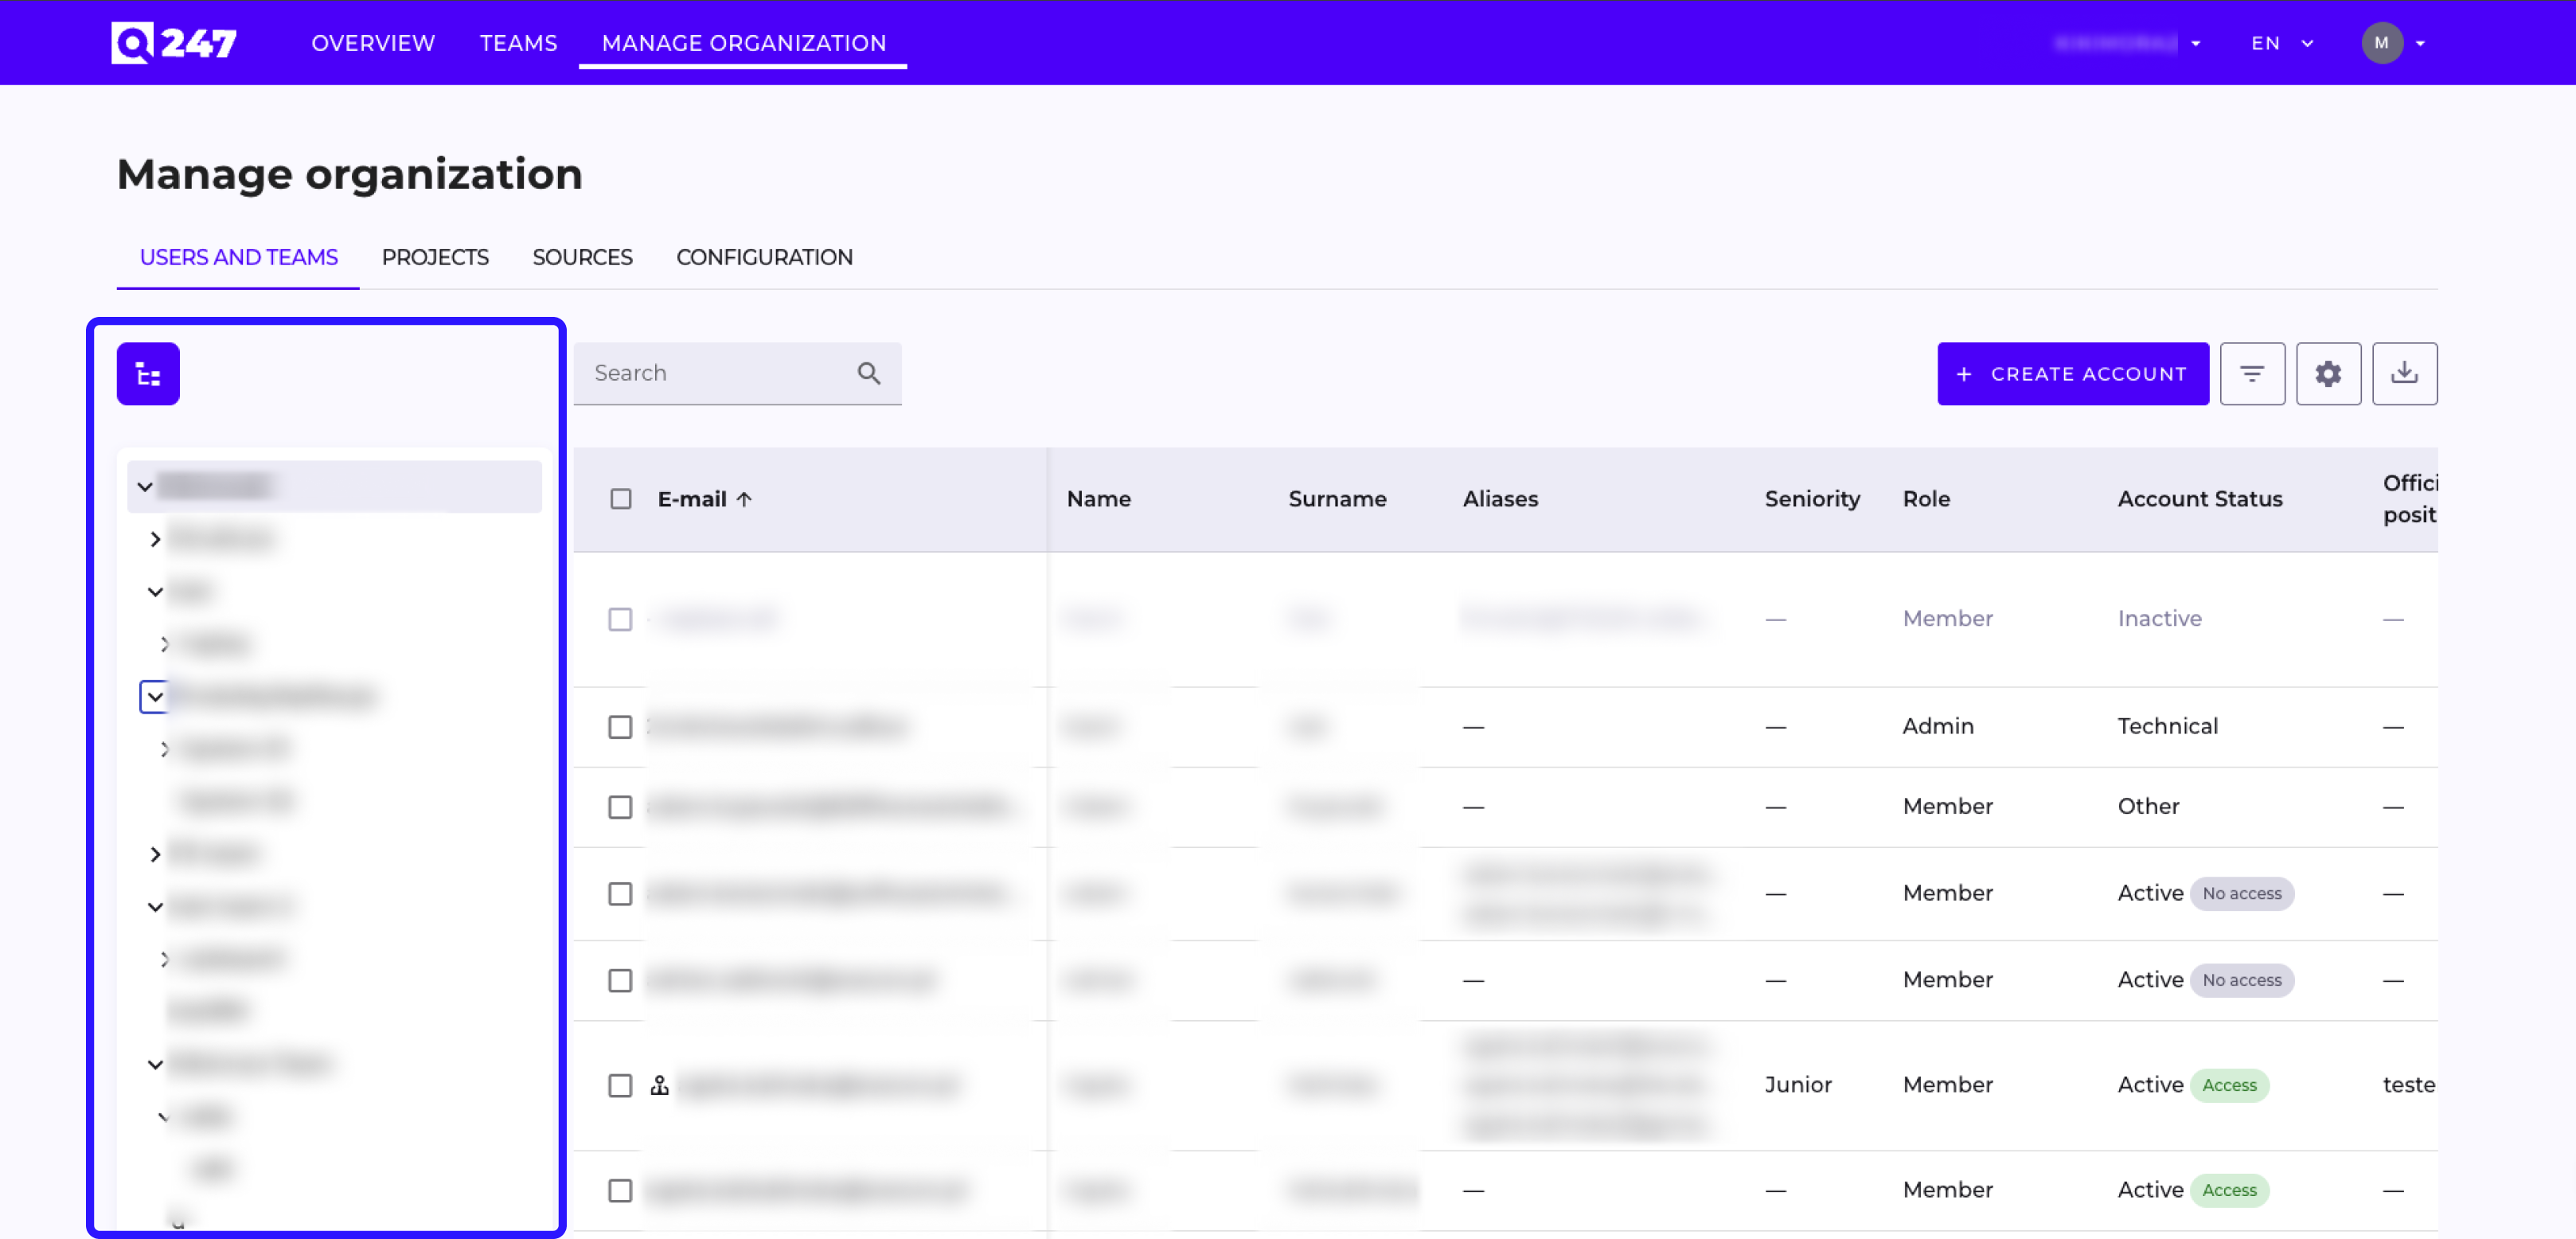
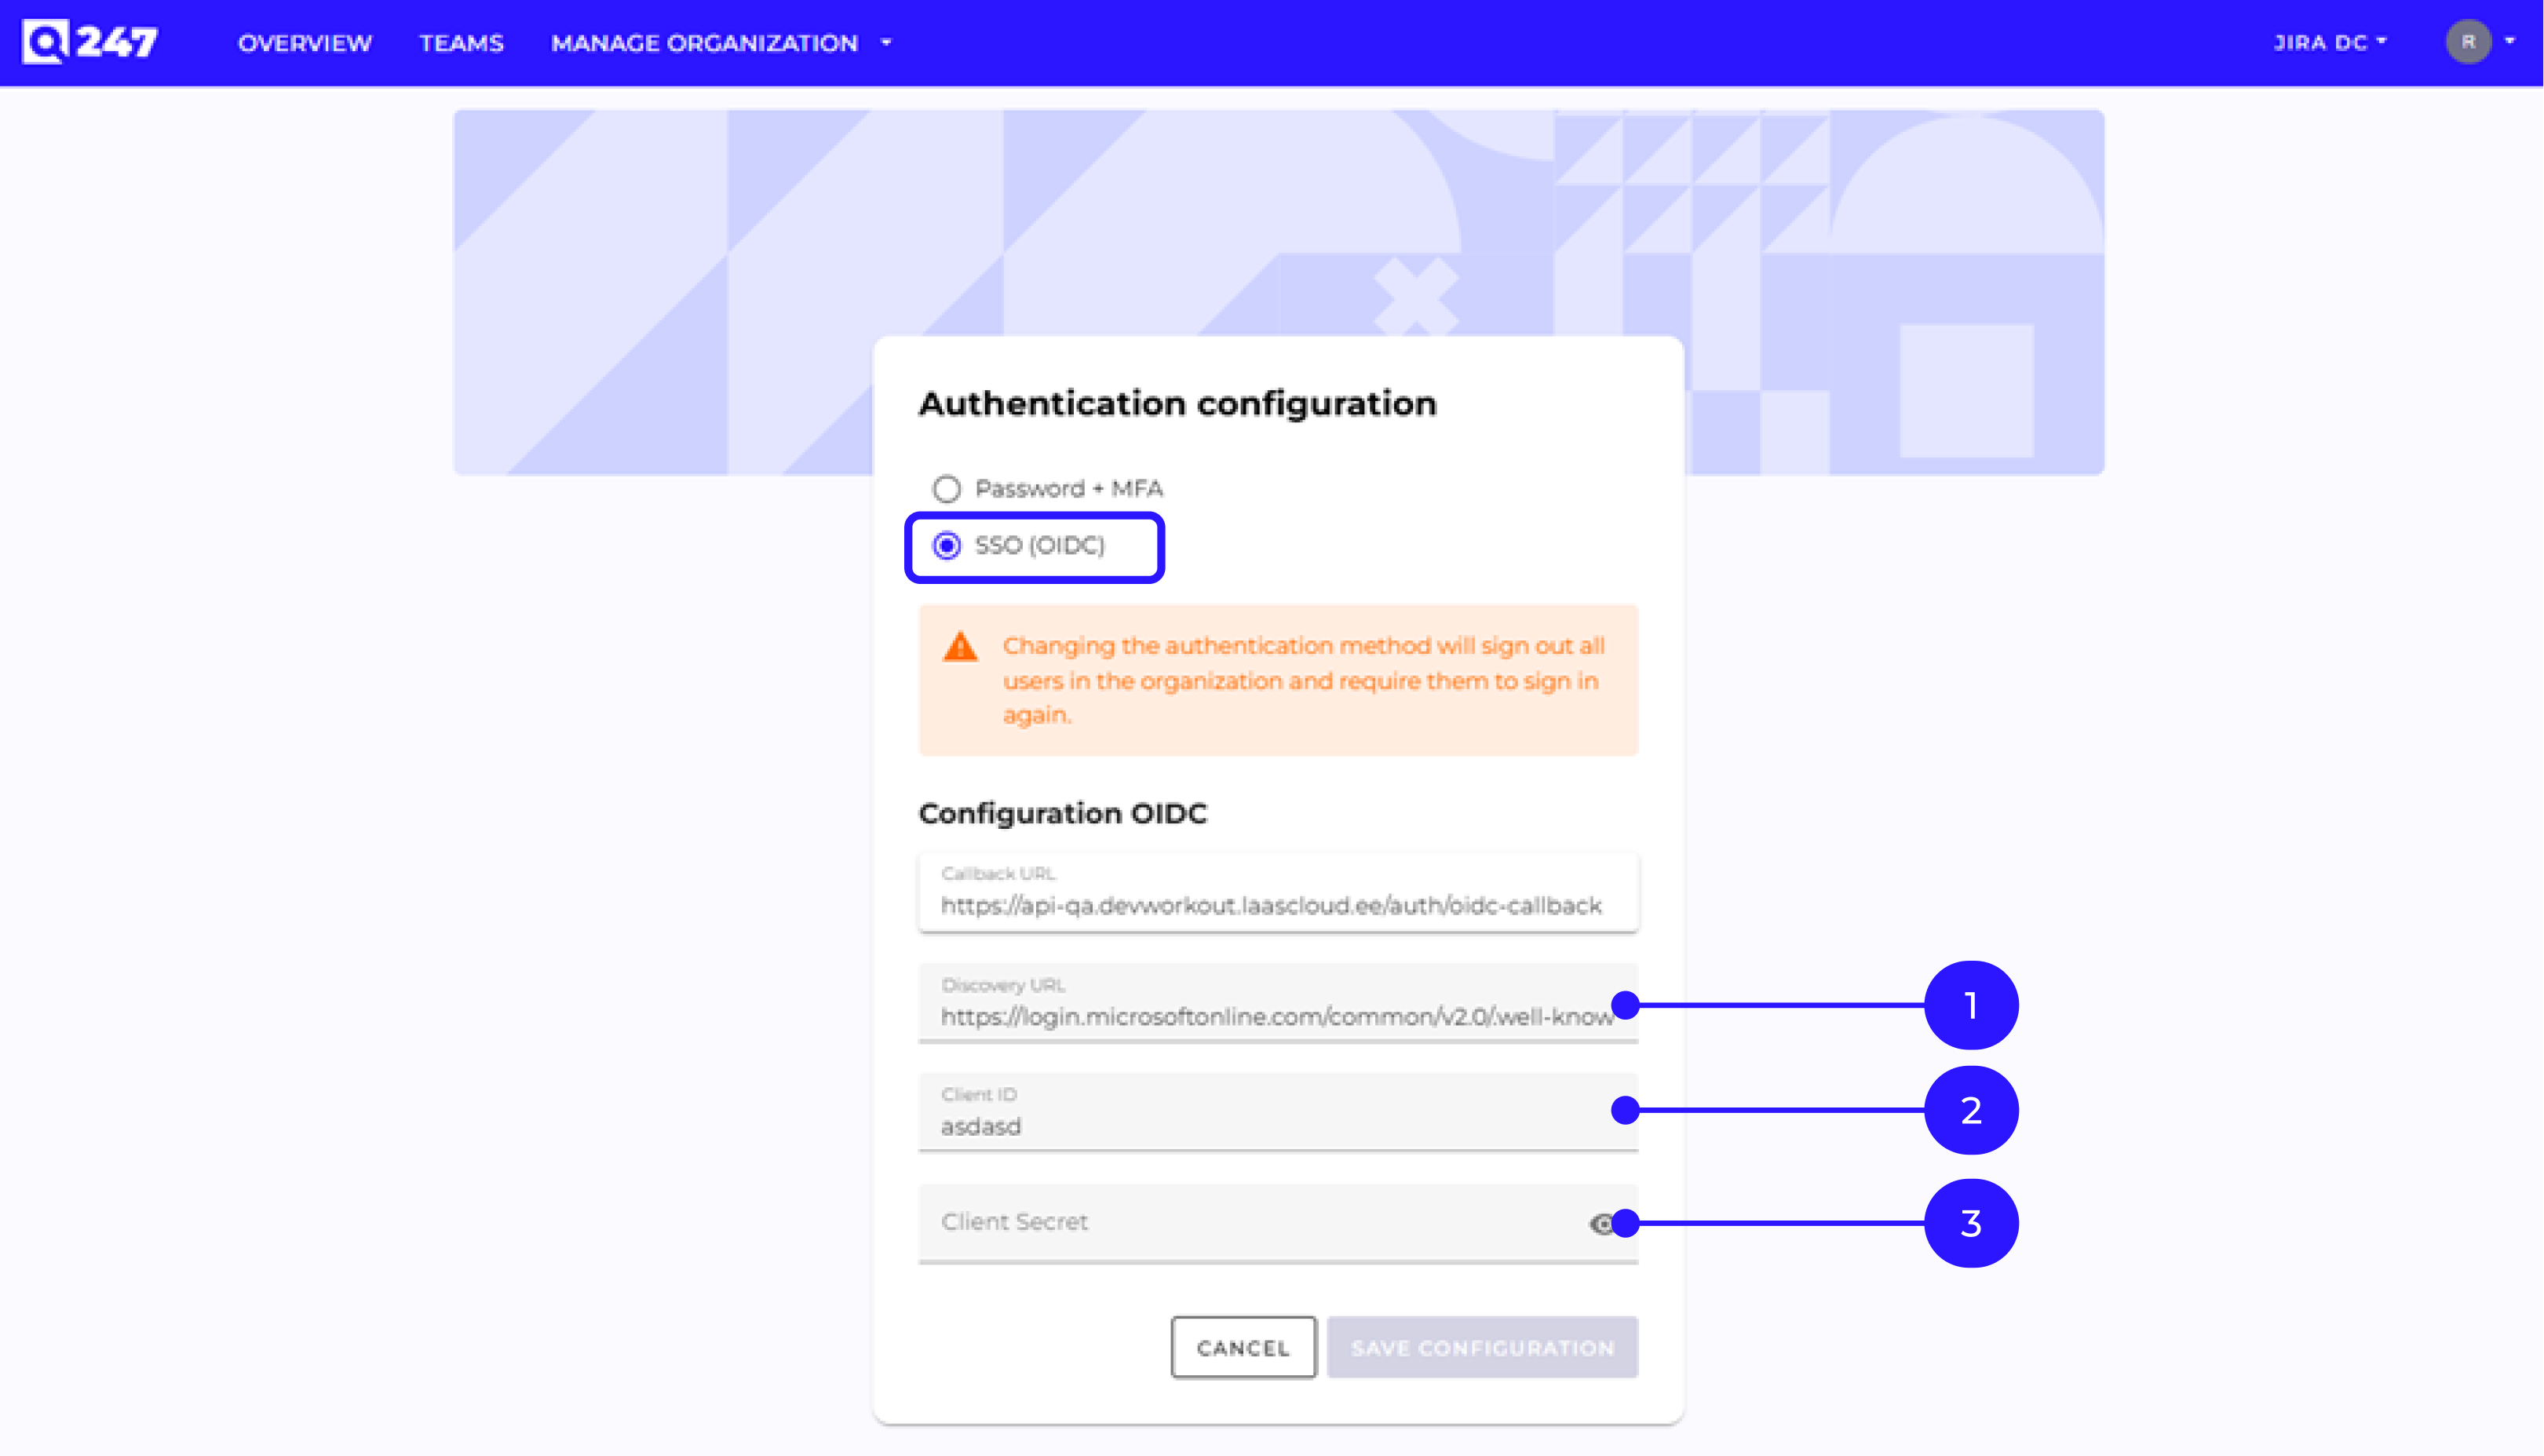
Q247 now supports the SCIM 2.0 standard — accounts and teams are automatically created, updated, deactivated, and removed based on events from an identity provider (Okta, Microsoft Entra ID, Google Workspace, or any other SCIM 2.0 system). The identity provider also groups users into teams (each synchronized group appears as a team in Q247) and maintains membership in those teams, while the arrangement of teams in the organization structure (Team Tree), promoting a member to manager, and team-to-project assignments remain on the Q247 side.
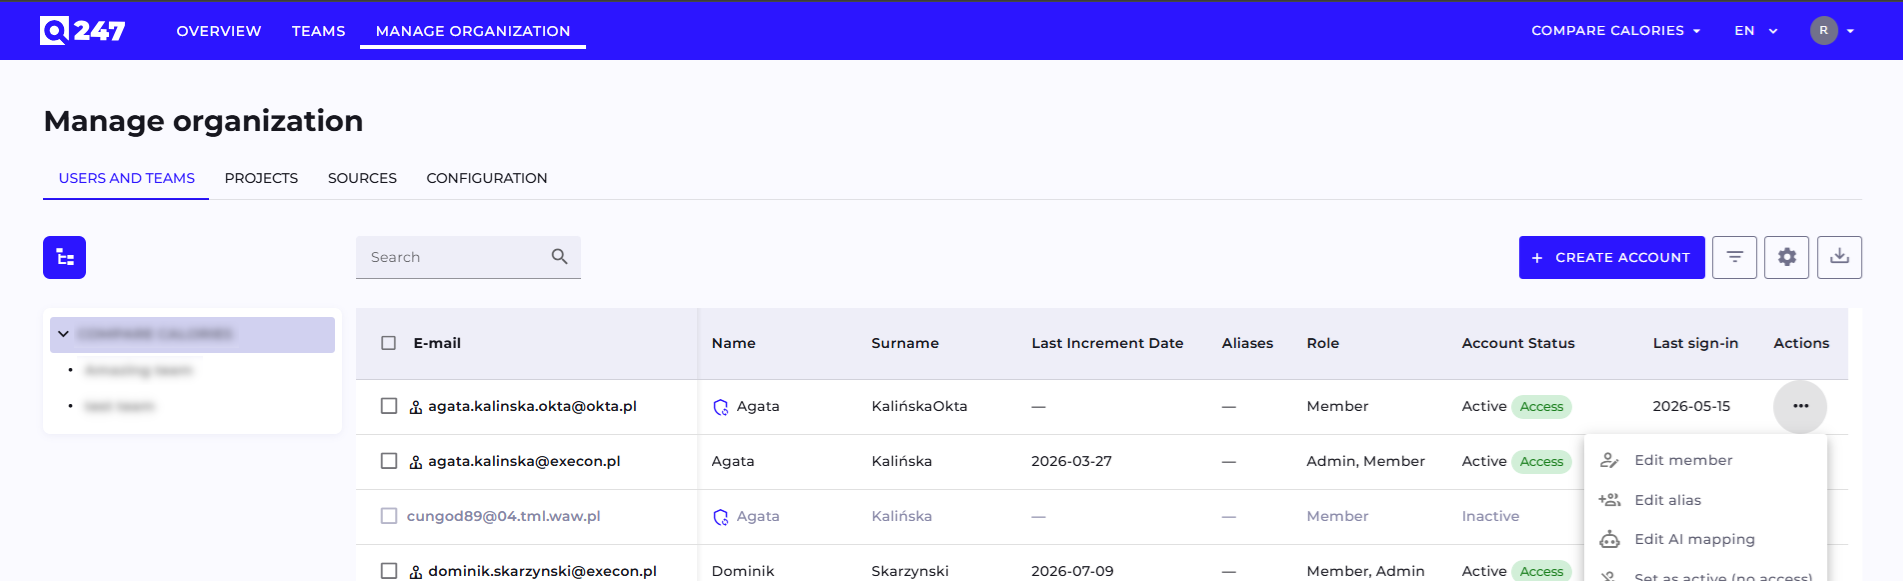
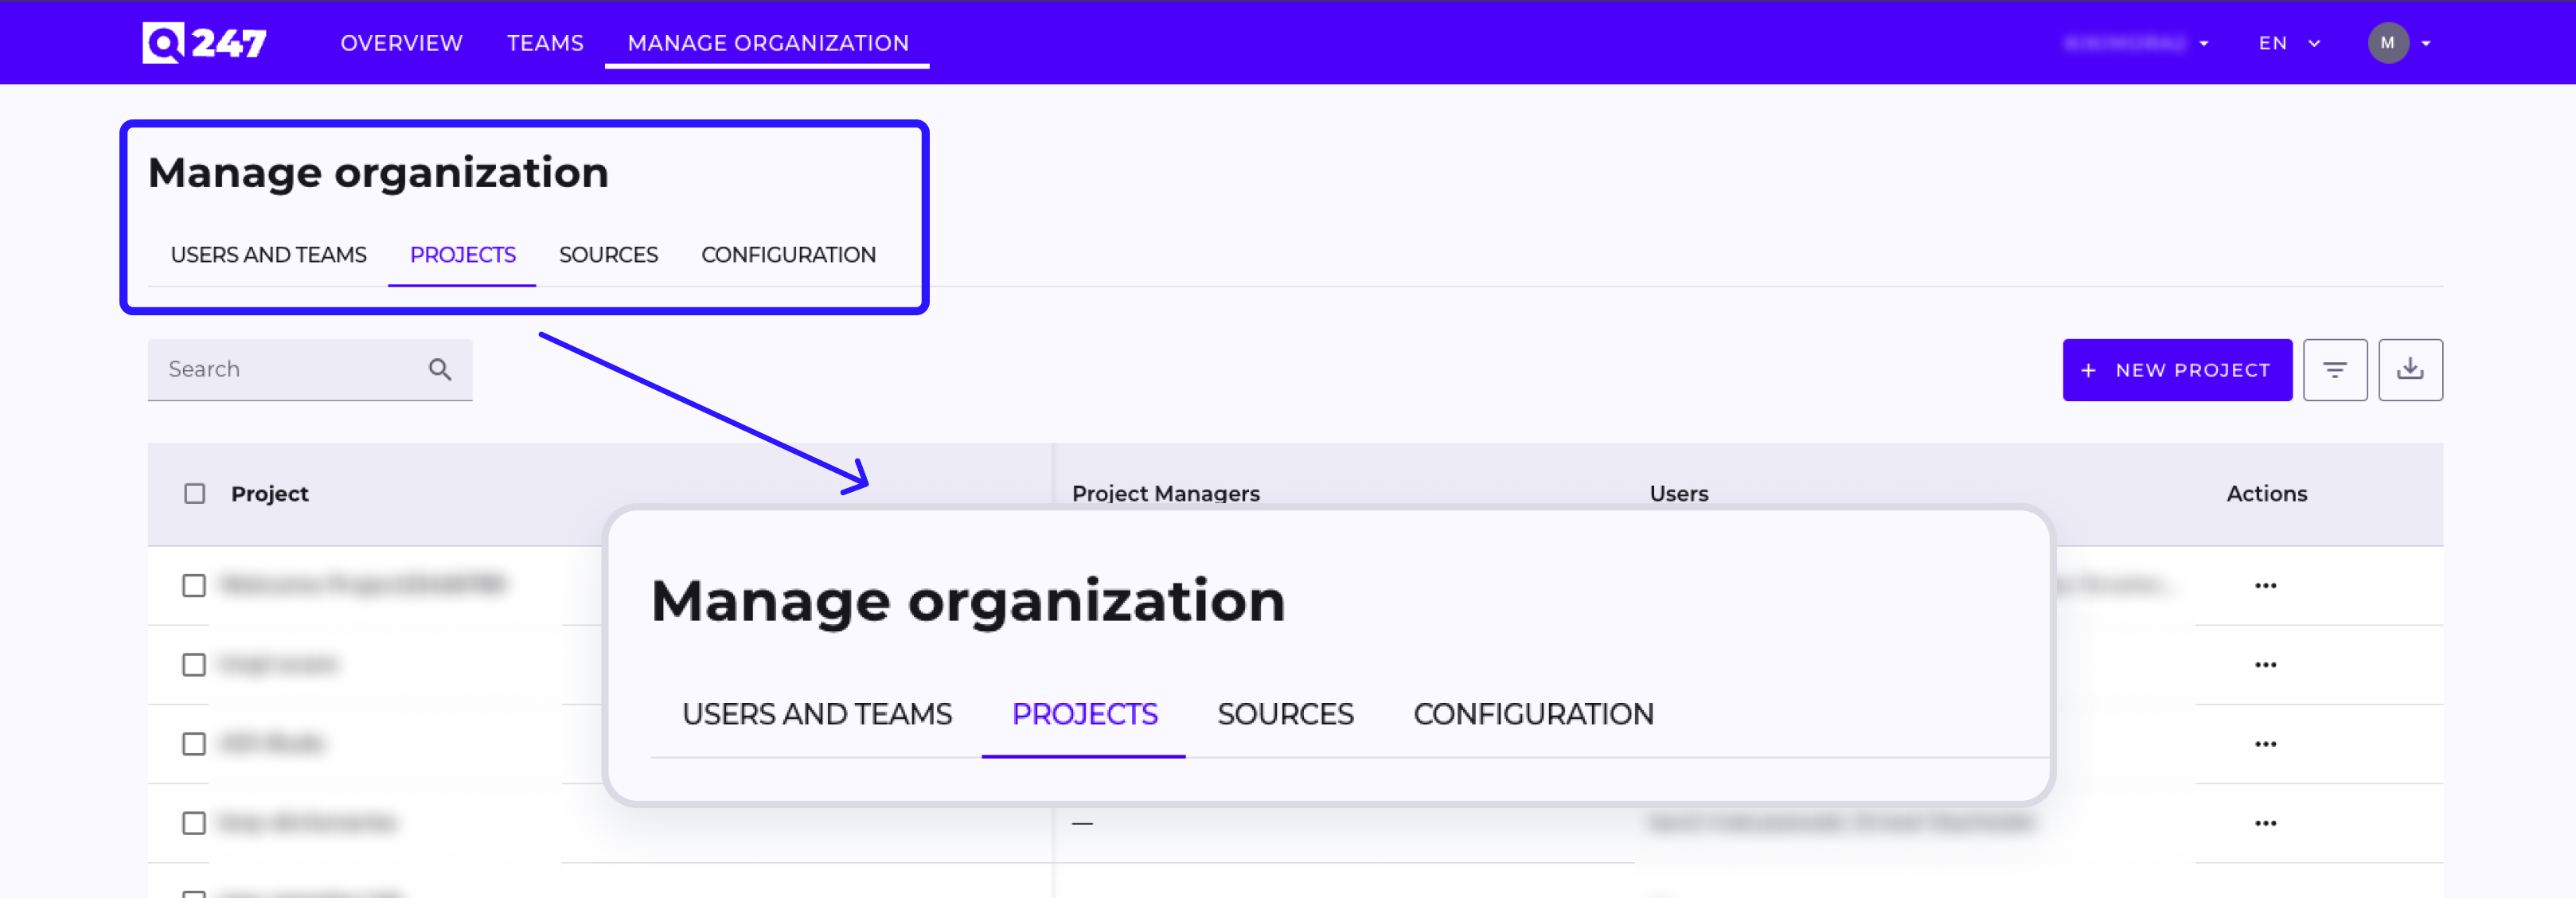
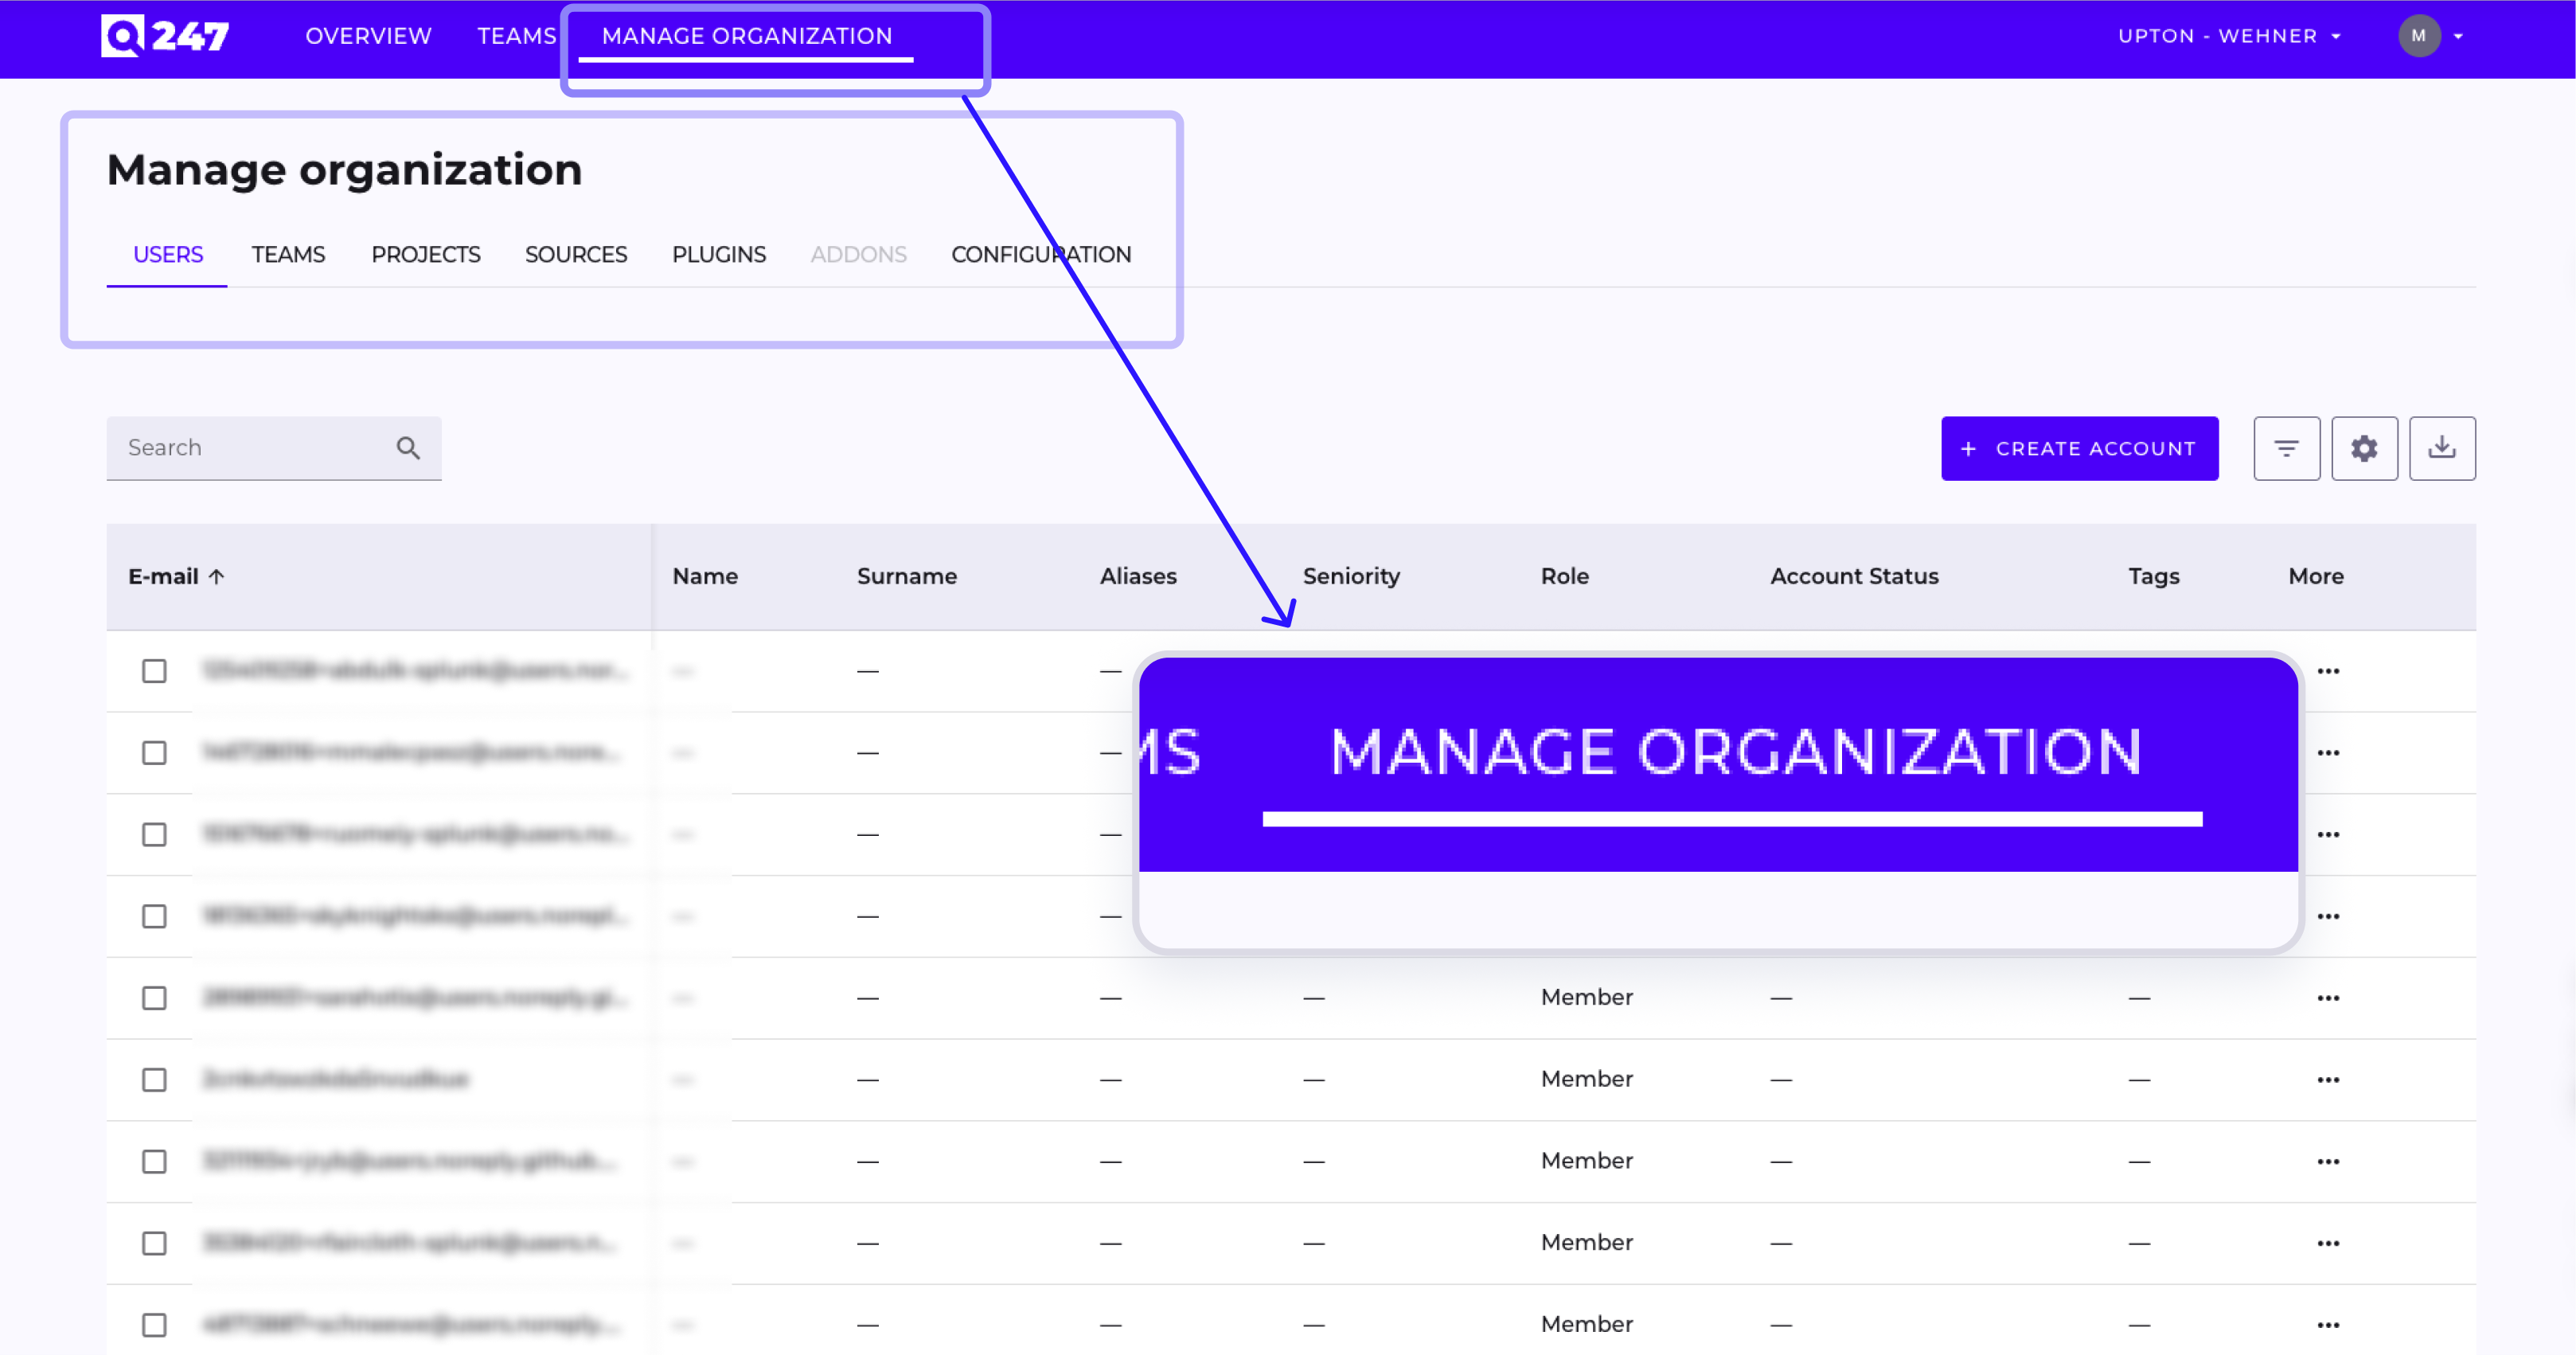
The integration is enabled in Manage Organization → Configuration → SCIM Provisioning, where Q247 generates a one-time bearer token and a SCIM endpoint address to configure on the identity provider side; if the token is lost, it can be rotated.
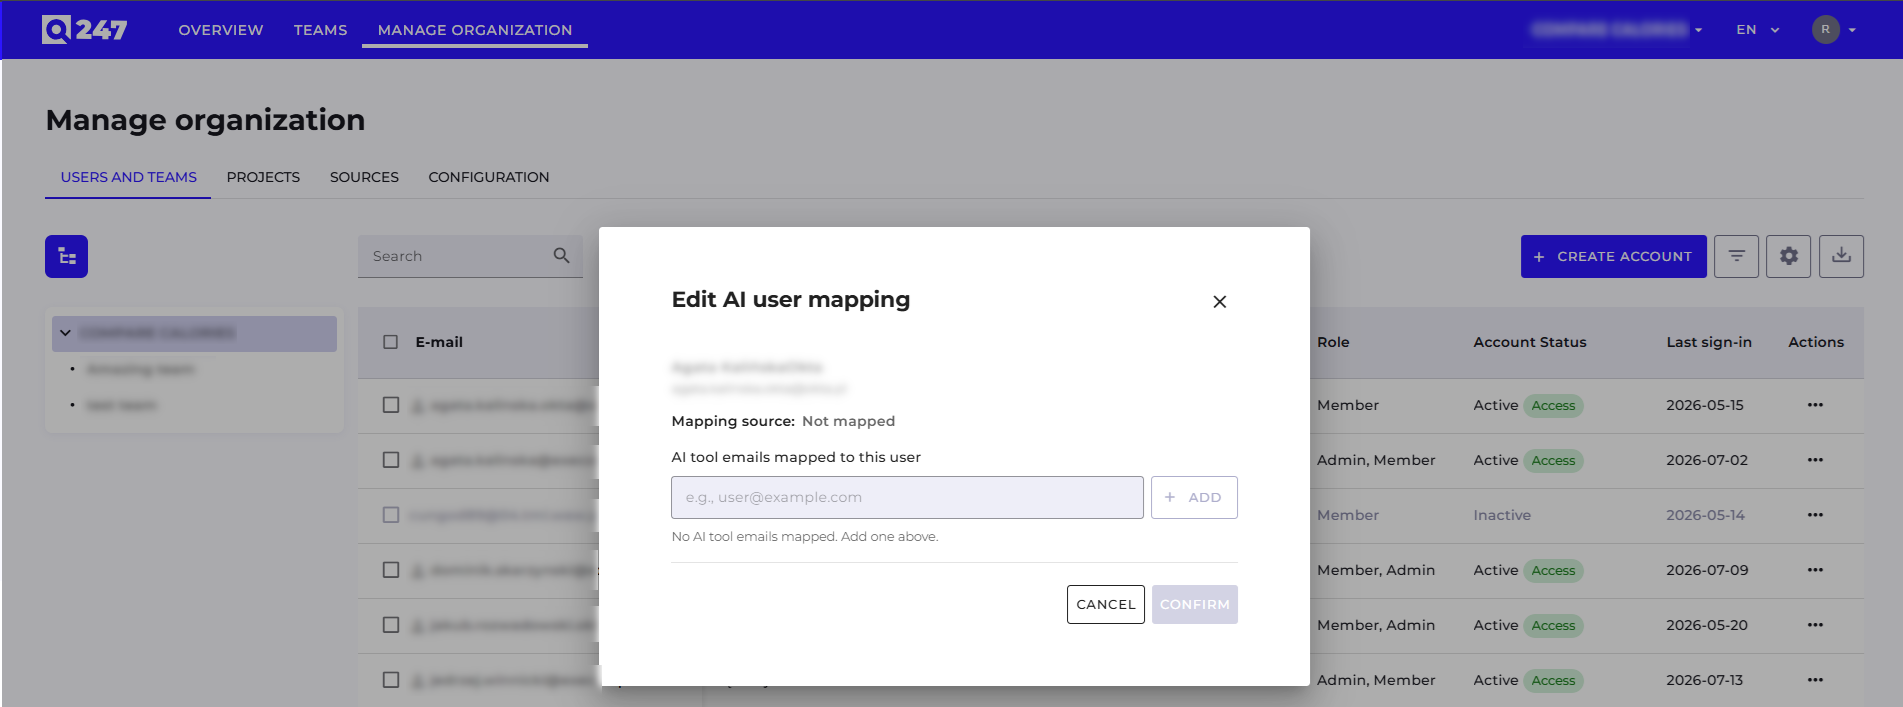
Optionally, an administrator can designate two SCIM groups: one automatically grants its members the ADMIN role (locking the role field on the profile), the other decides which IdP-linked users are allowed to log in — the two mappings are independent of each other.
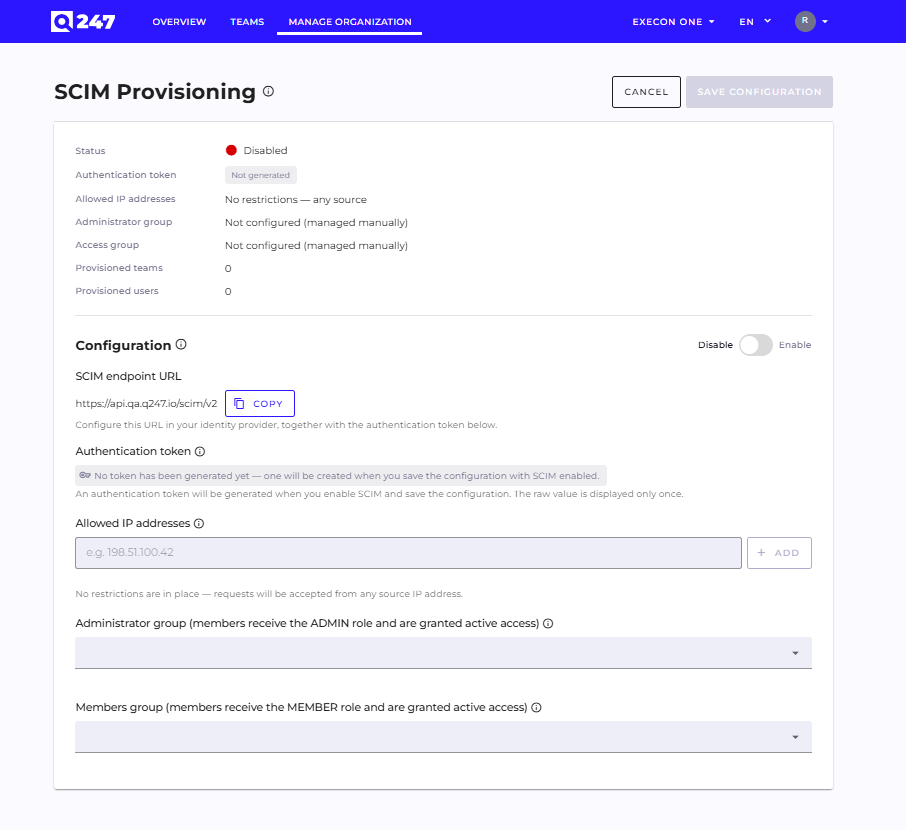
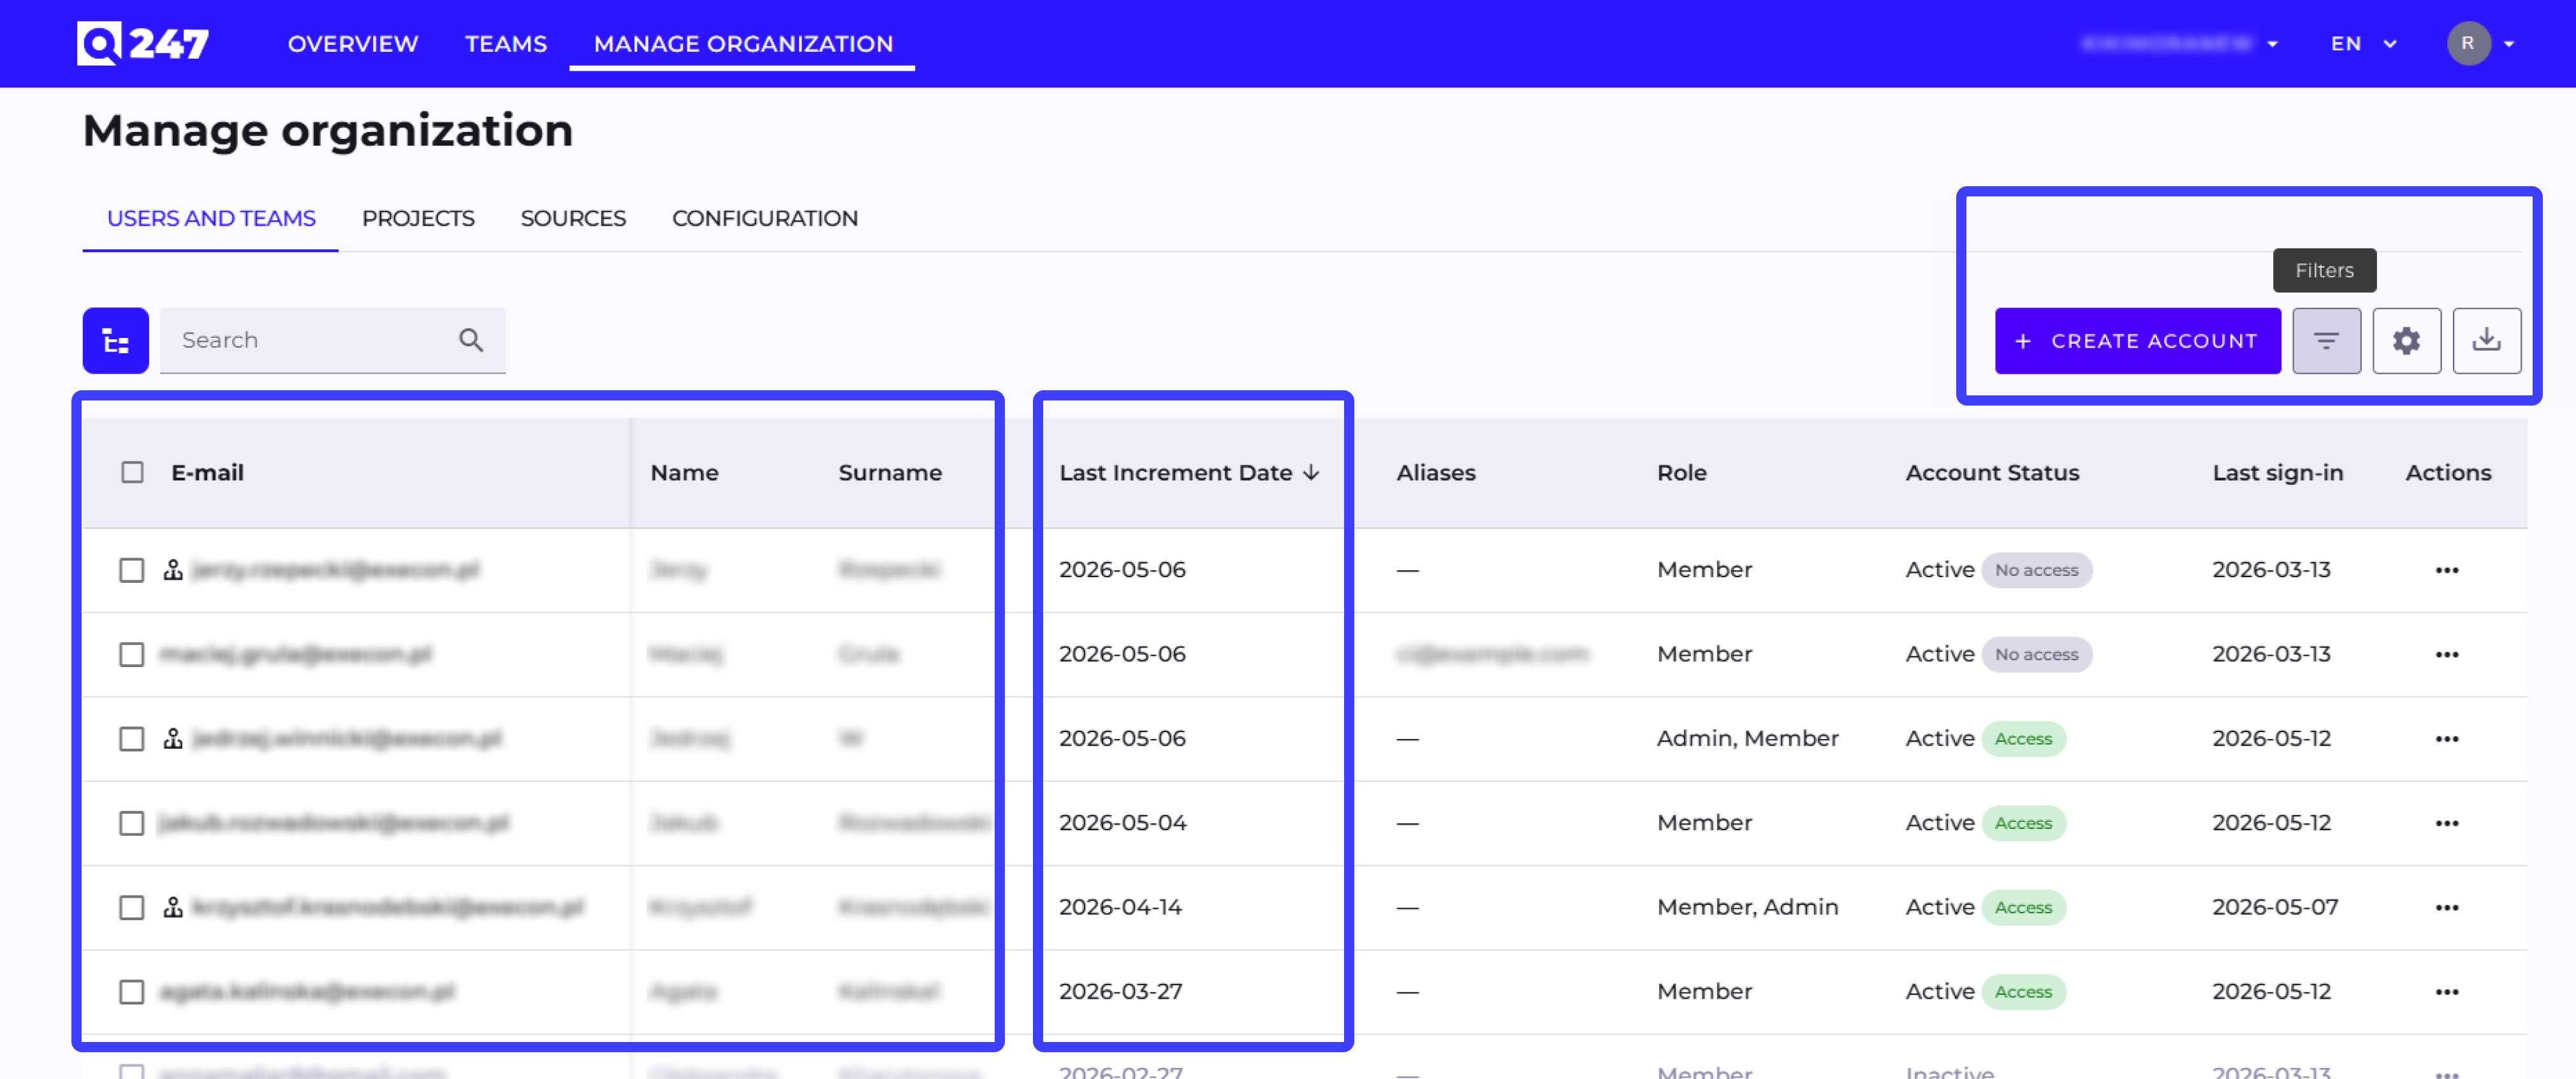
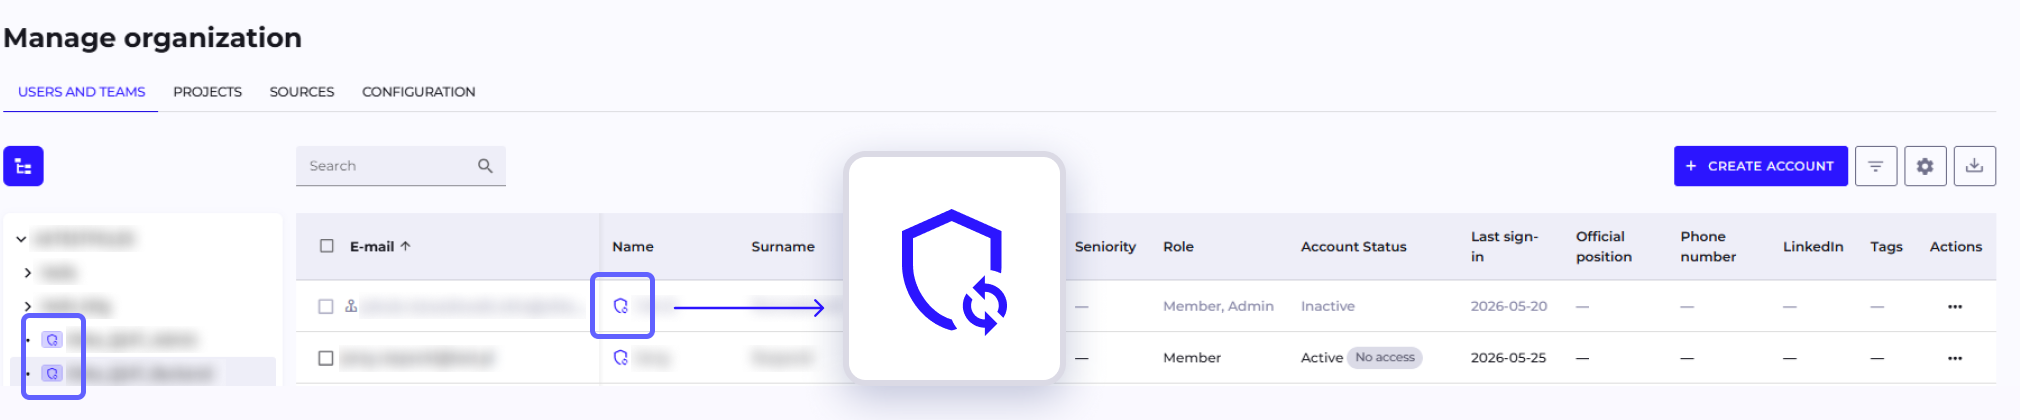
Users and teams managed by SCIM are marked with a purple "SCIM" badge; for such users the name, email, status, and SCIM team membership fields are locked, while project participation and membership in manually created teams remain editable. The configuration can additionally be narrowed with an allowed IP address list, and all SCIM operations are recorded in the change log with "SCIM" attribution.
Cherry-pick, Rebase, and Revert Detection in Repository History
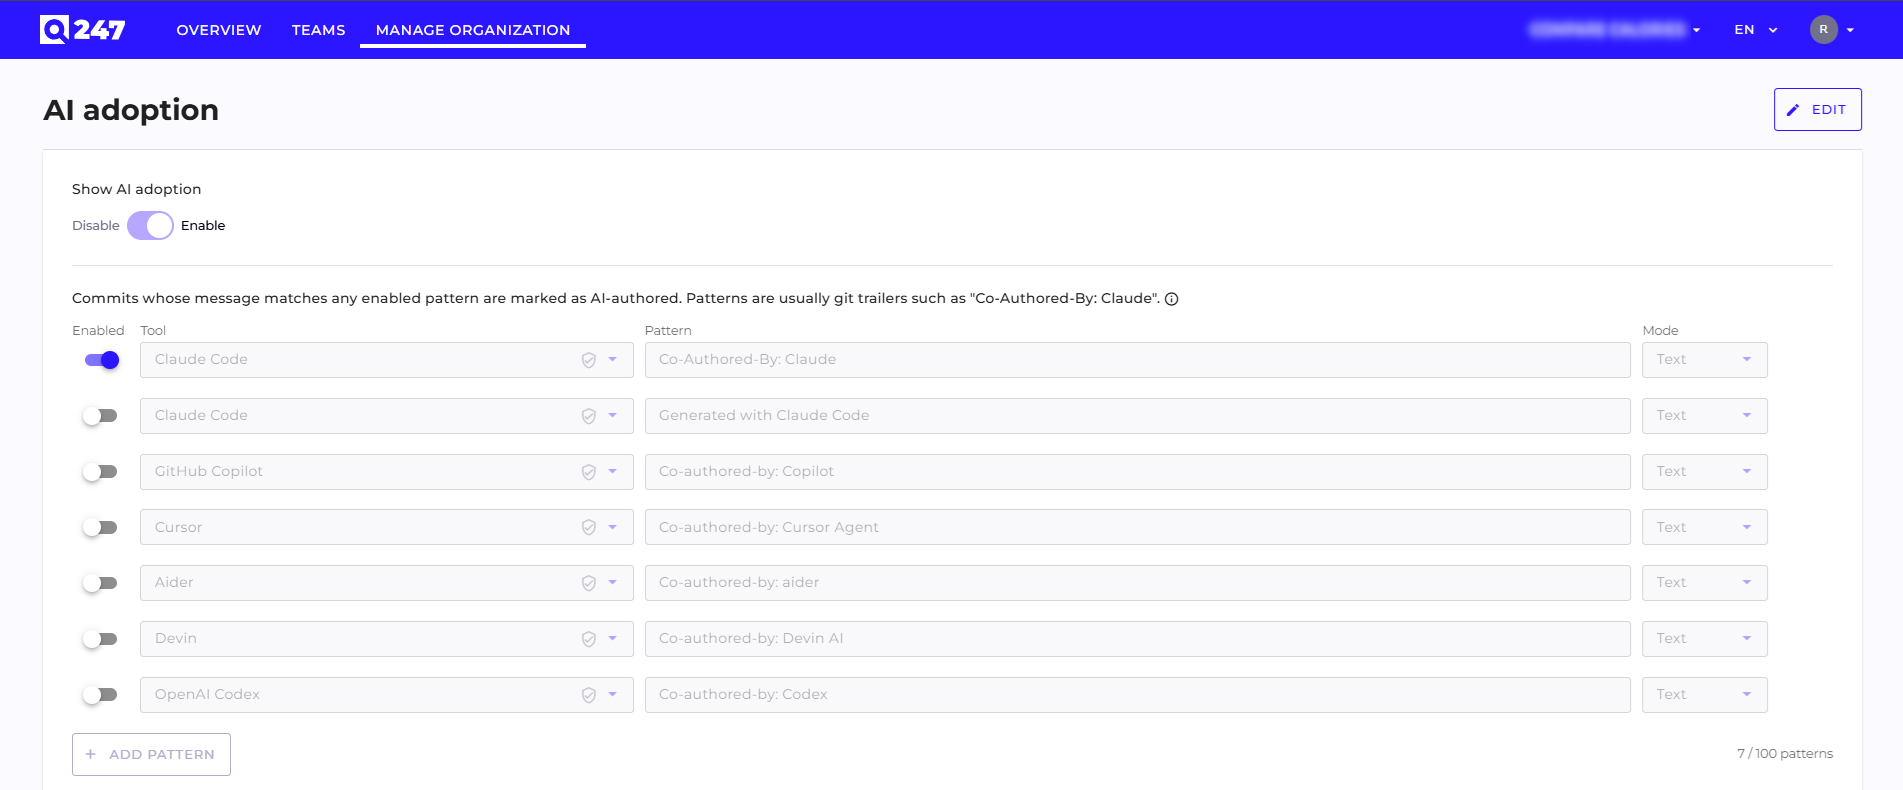
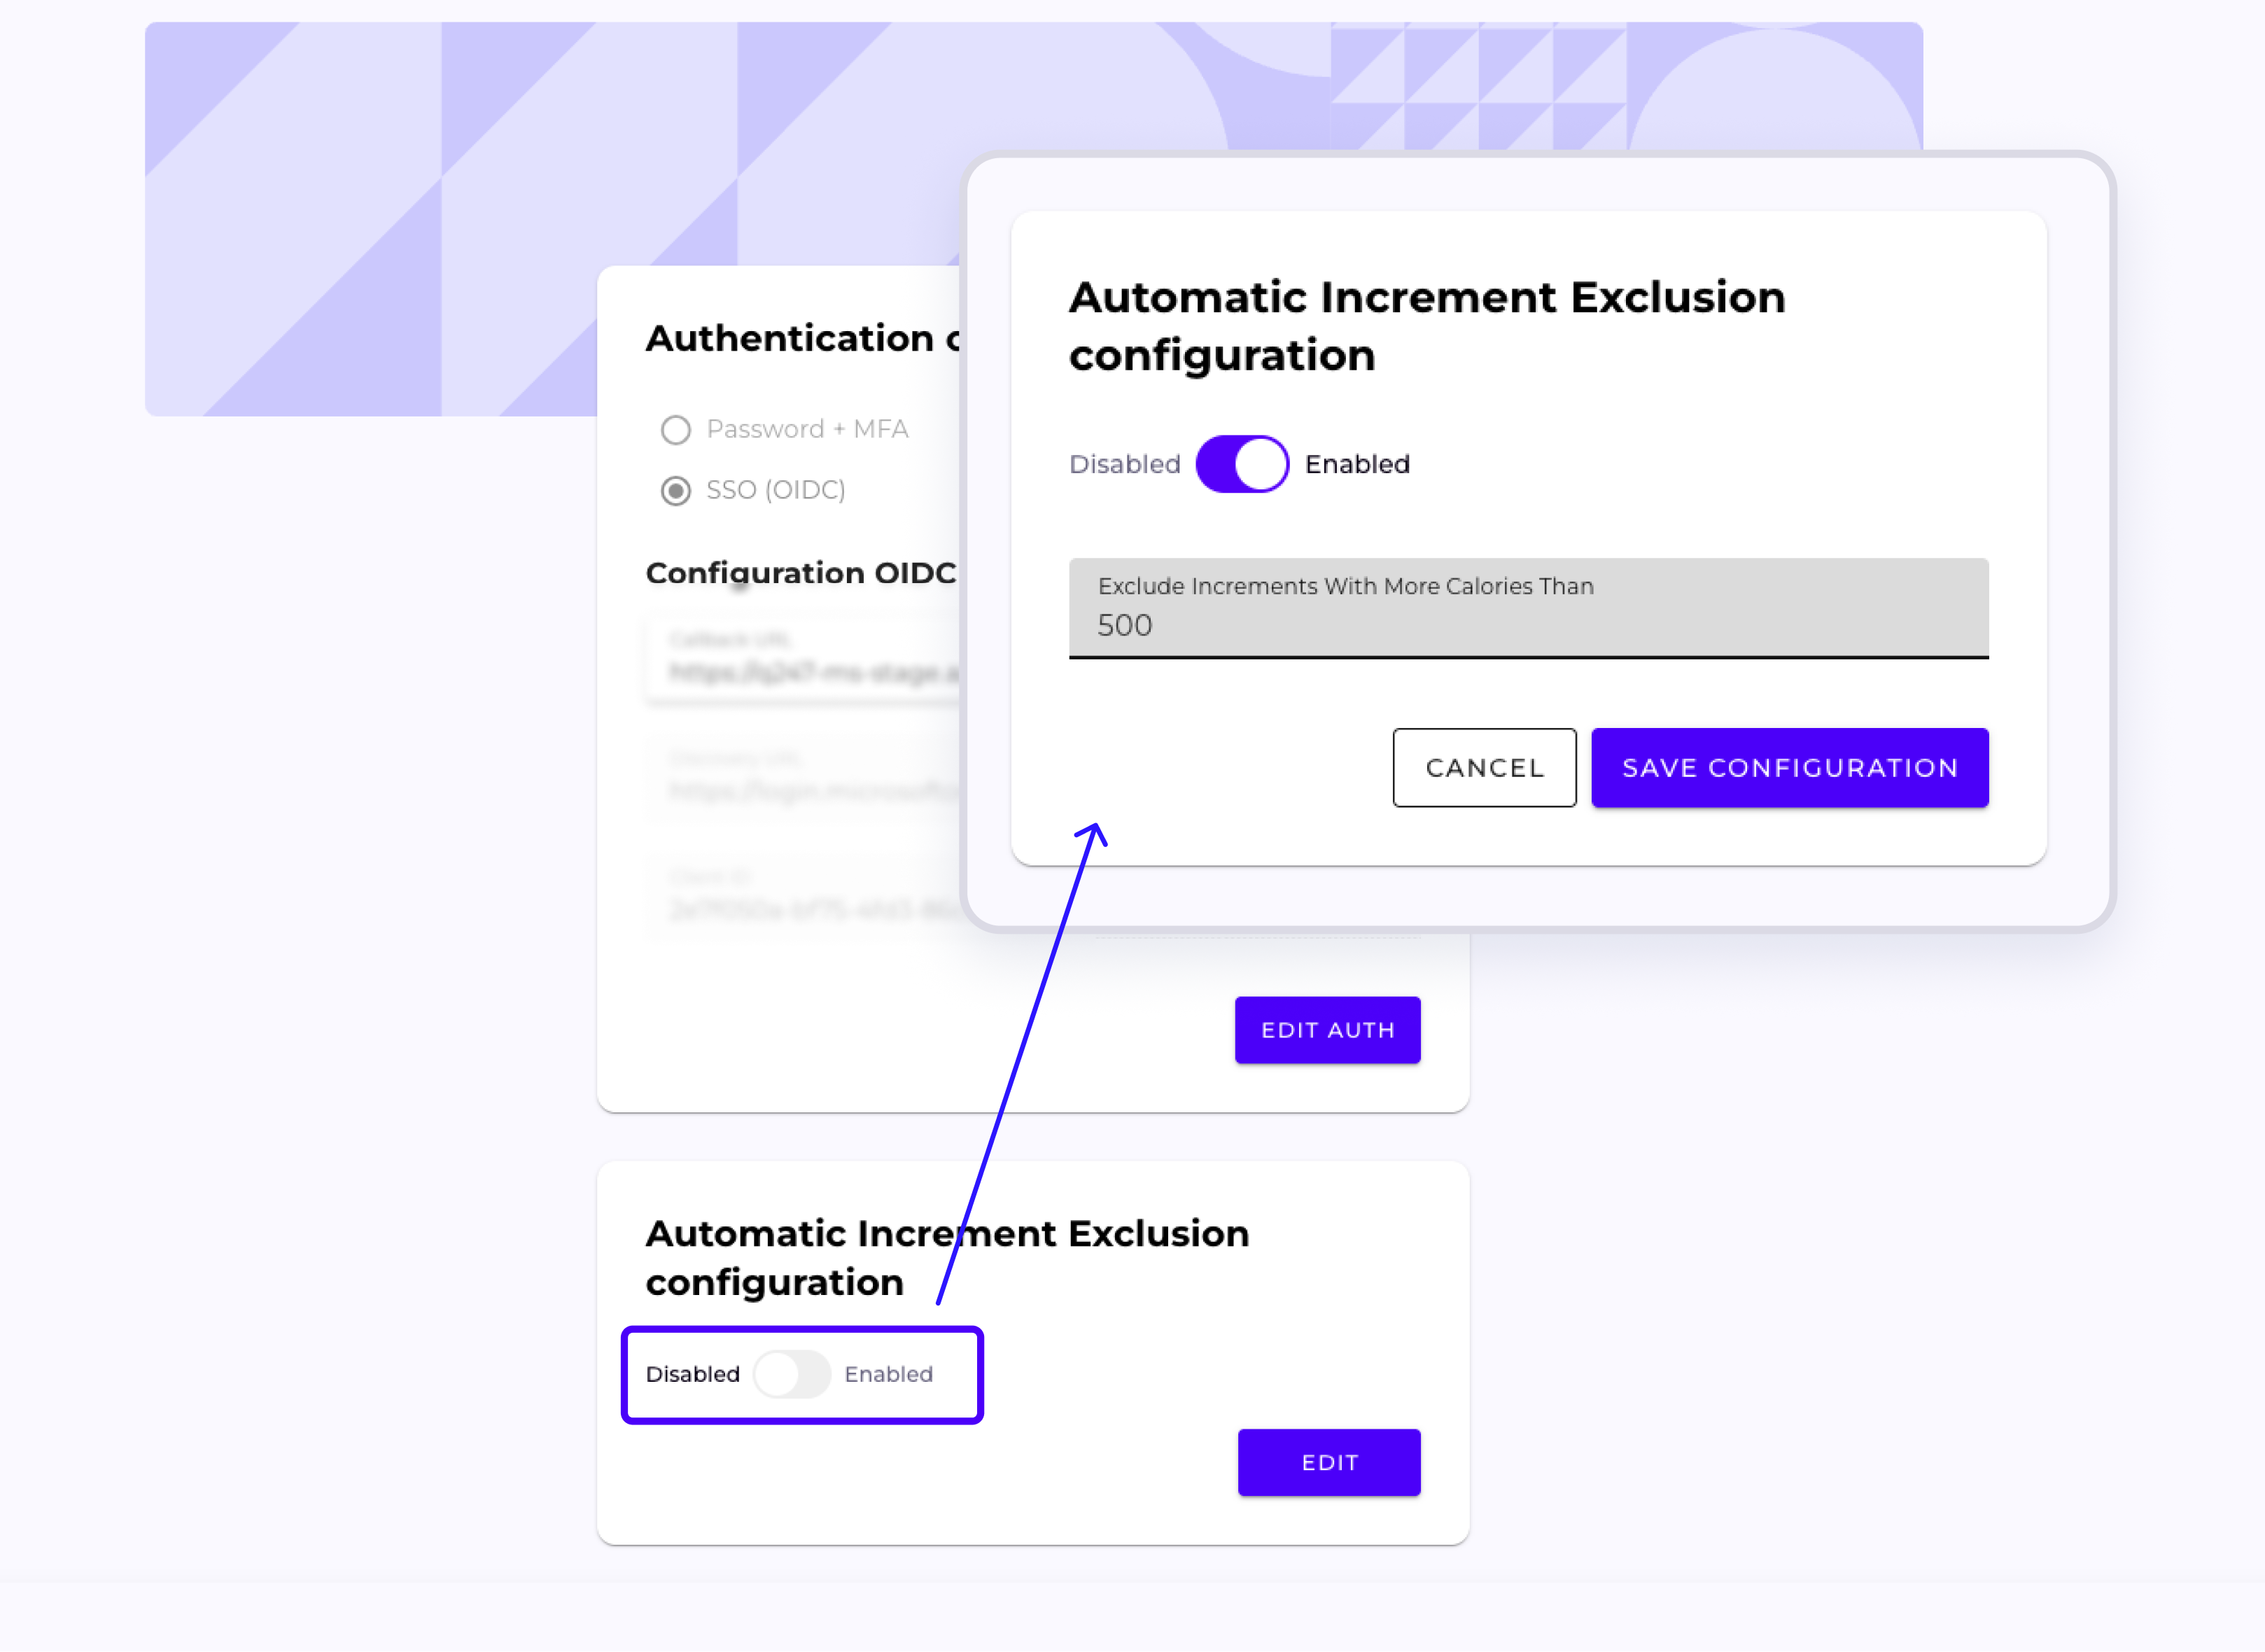
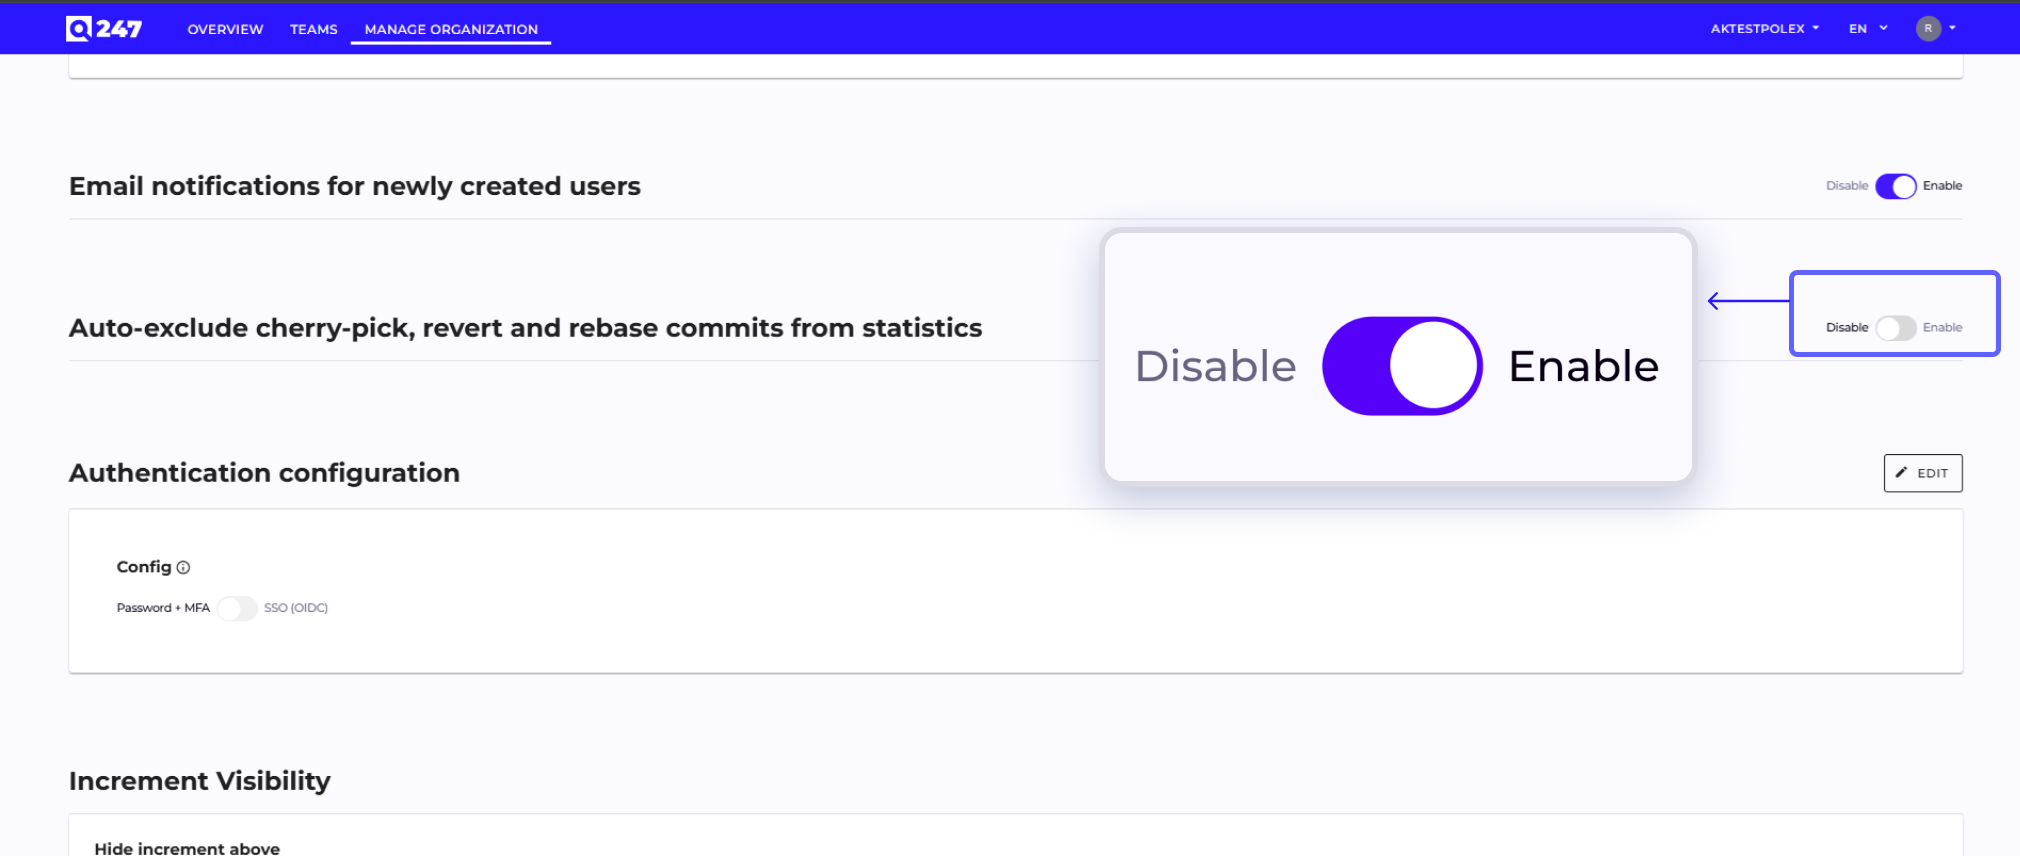
Q247 classifies commits resulting from cherry-pick, rebase, or revert and lets you optionally exclude them from activity metric statistics (Coding Calories, Increments, Activity, and others). The mechanism is enabled by the organization administrator via the "exclude cherry-pick / rebase / revert from metrics" flag at the organization level; once enabled, classified commits are marked as excluded, stop counting toward team, project, and participant statistics, and by default no longer appear on the Delivery Tracker chart.
The classification works in two ways: first, based on the commit message — the phrase cherry picked from commit in the body indicates a cherry-pick, and the phrase This reverts commit indicates a revert (with precedence if a commit matches both rules); second, based on the commit identity — if more than one commit with an identical author, author date, and identical list of changed files exists on the same remote, the chronologically first one is treated as the base, and the subsequent duplicates as rebase / cherry-pick.
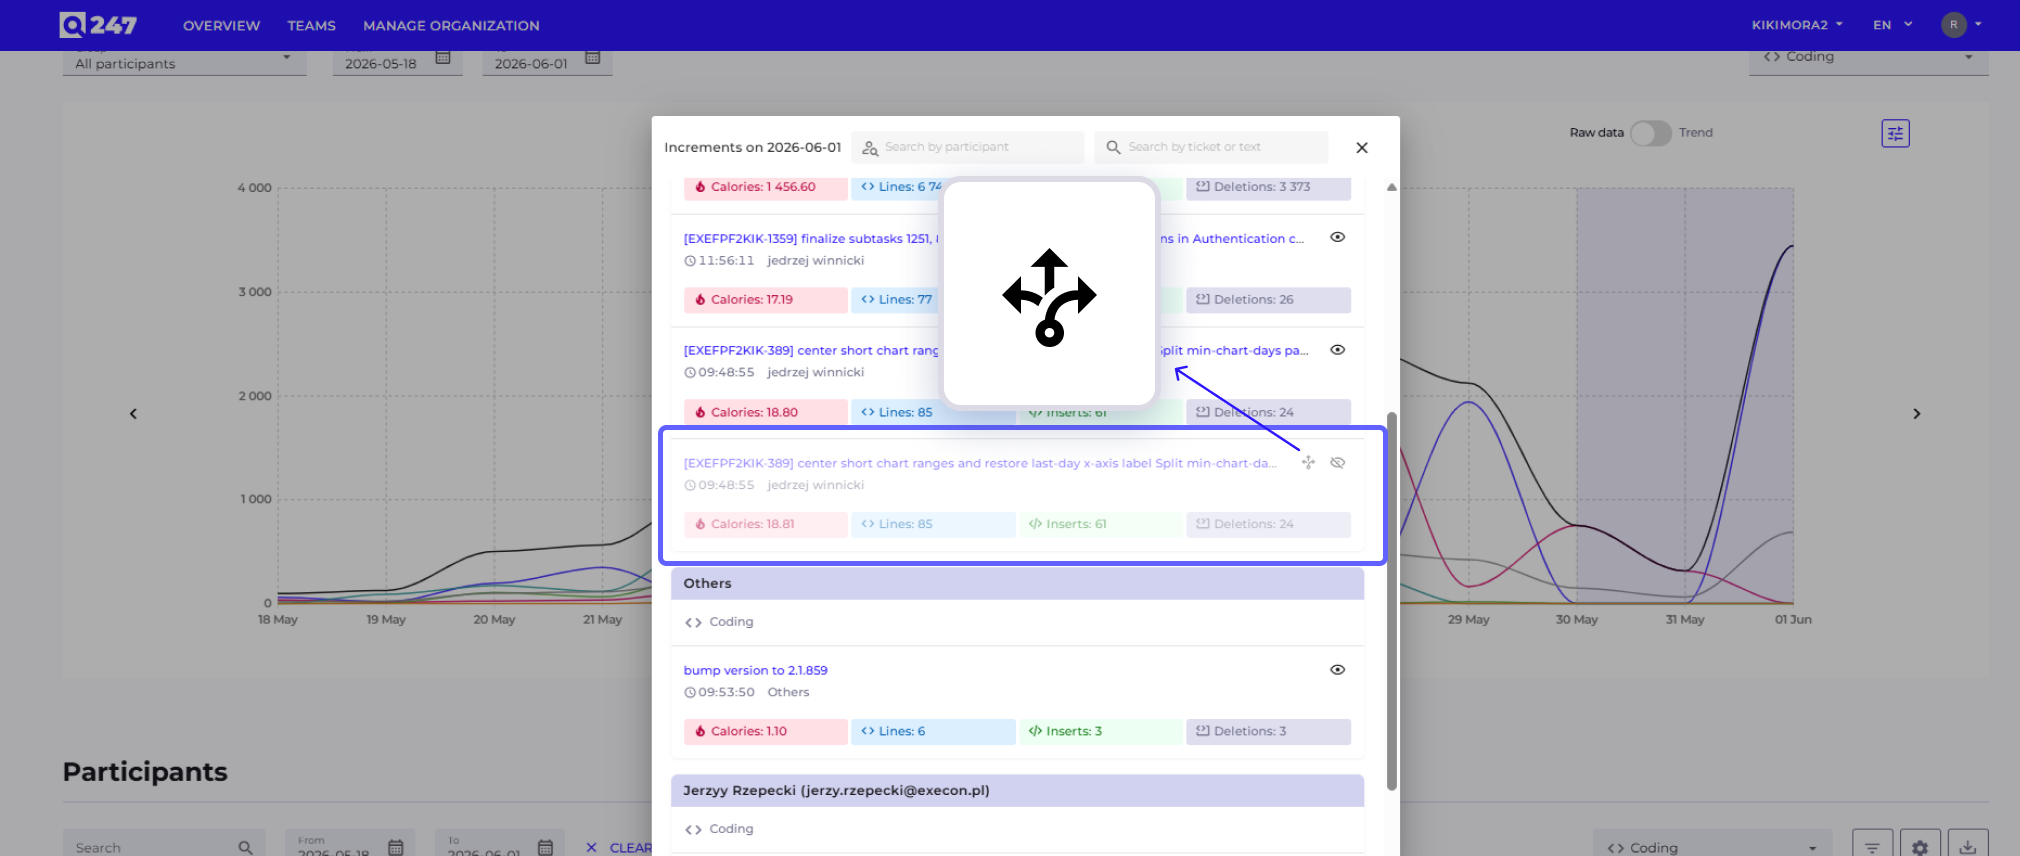
Analogous logic was run retroactively across the entire base of existing commits, so historical metrics reflect the new classification once the flag is enabled. A single excluded commit can be manually restored to the statistics from the commit details on the chart — excluded entries are also visually highlighted.
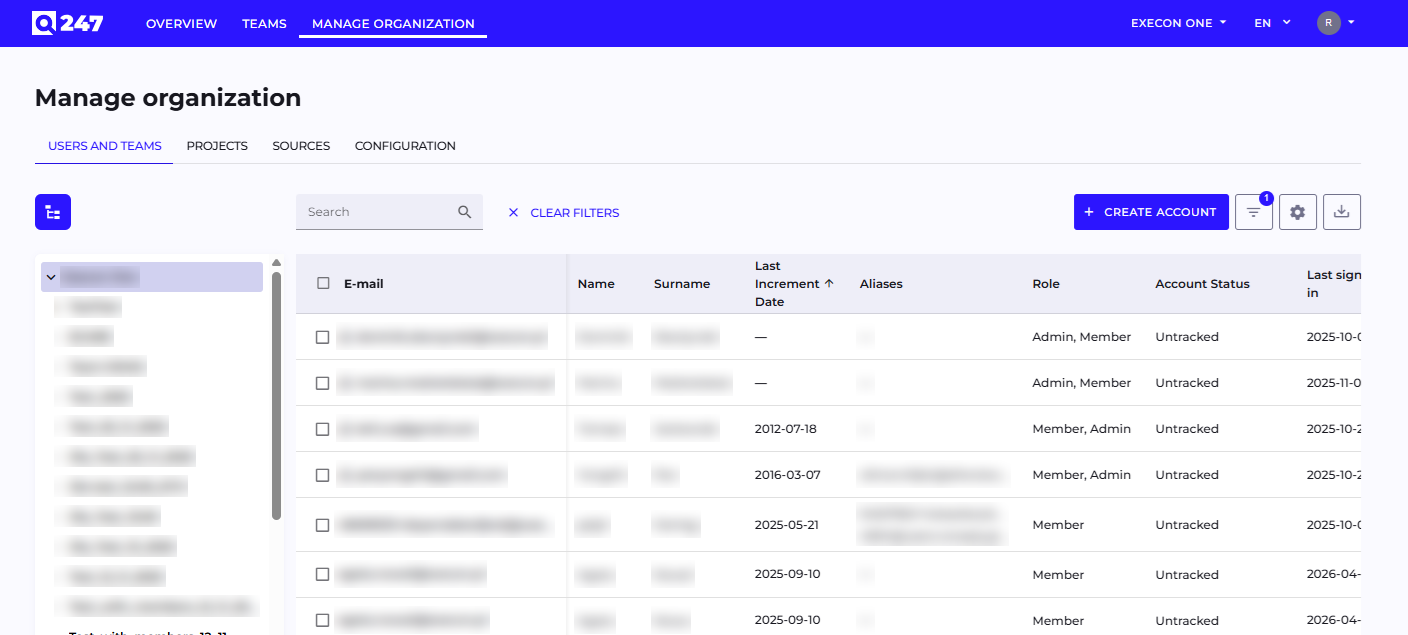
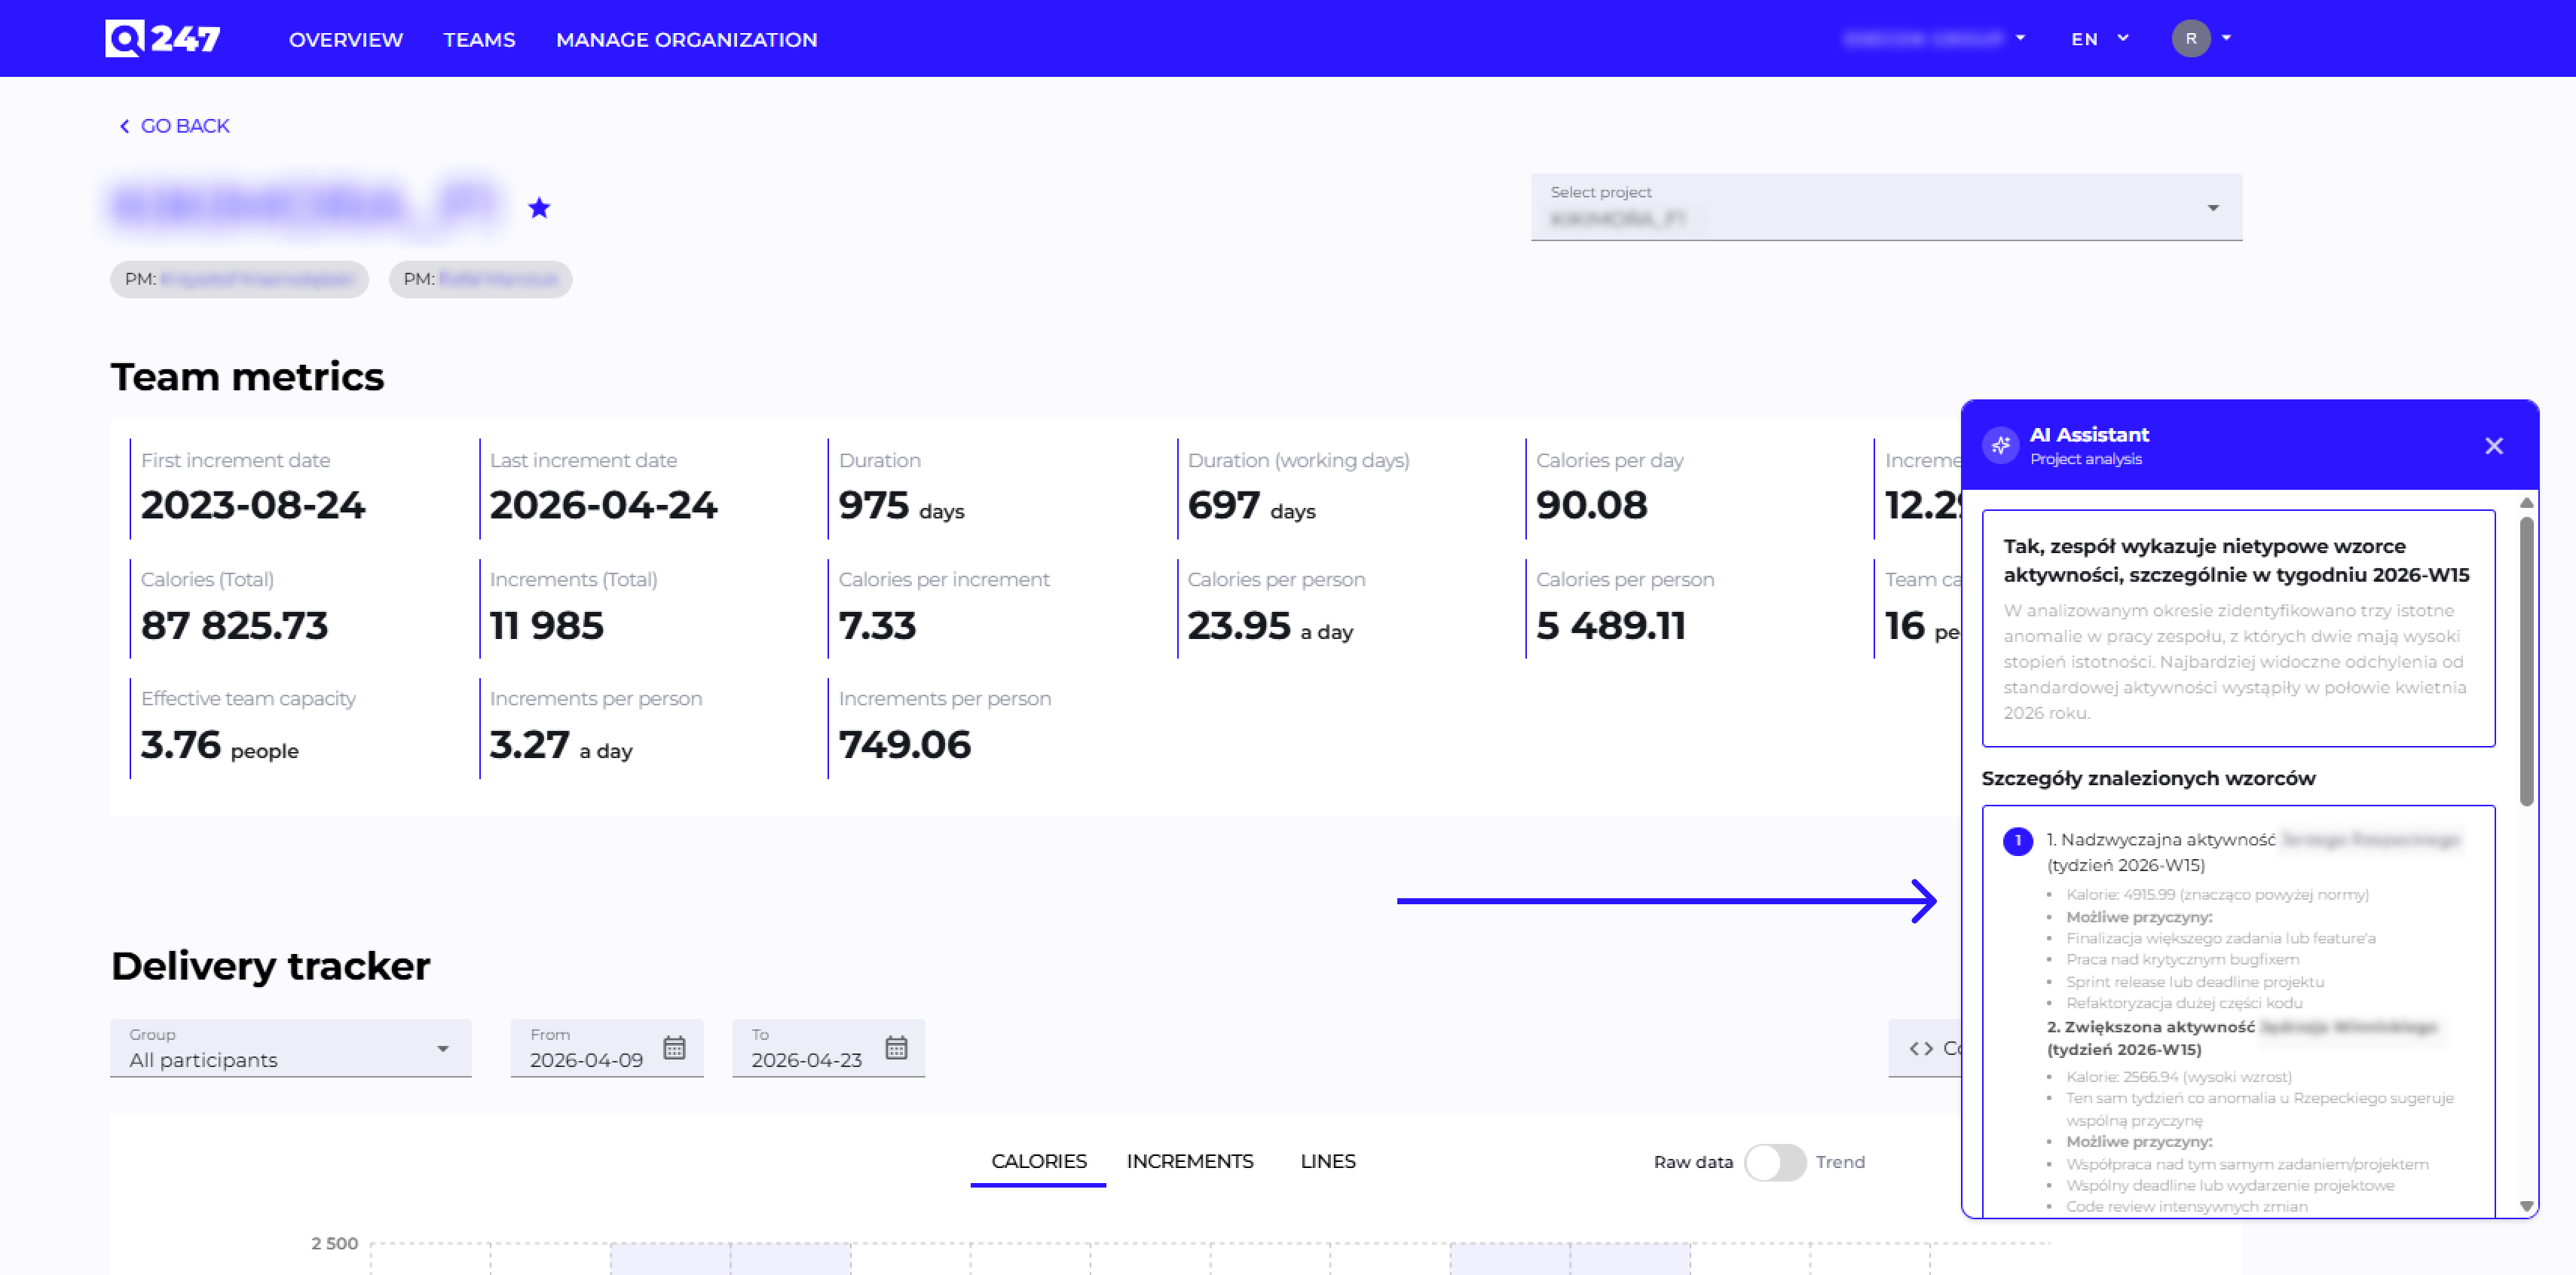
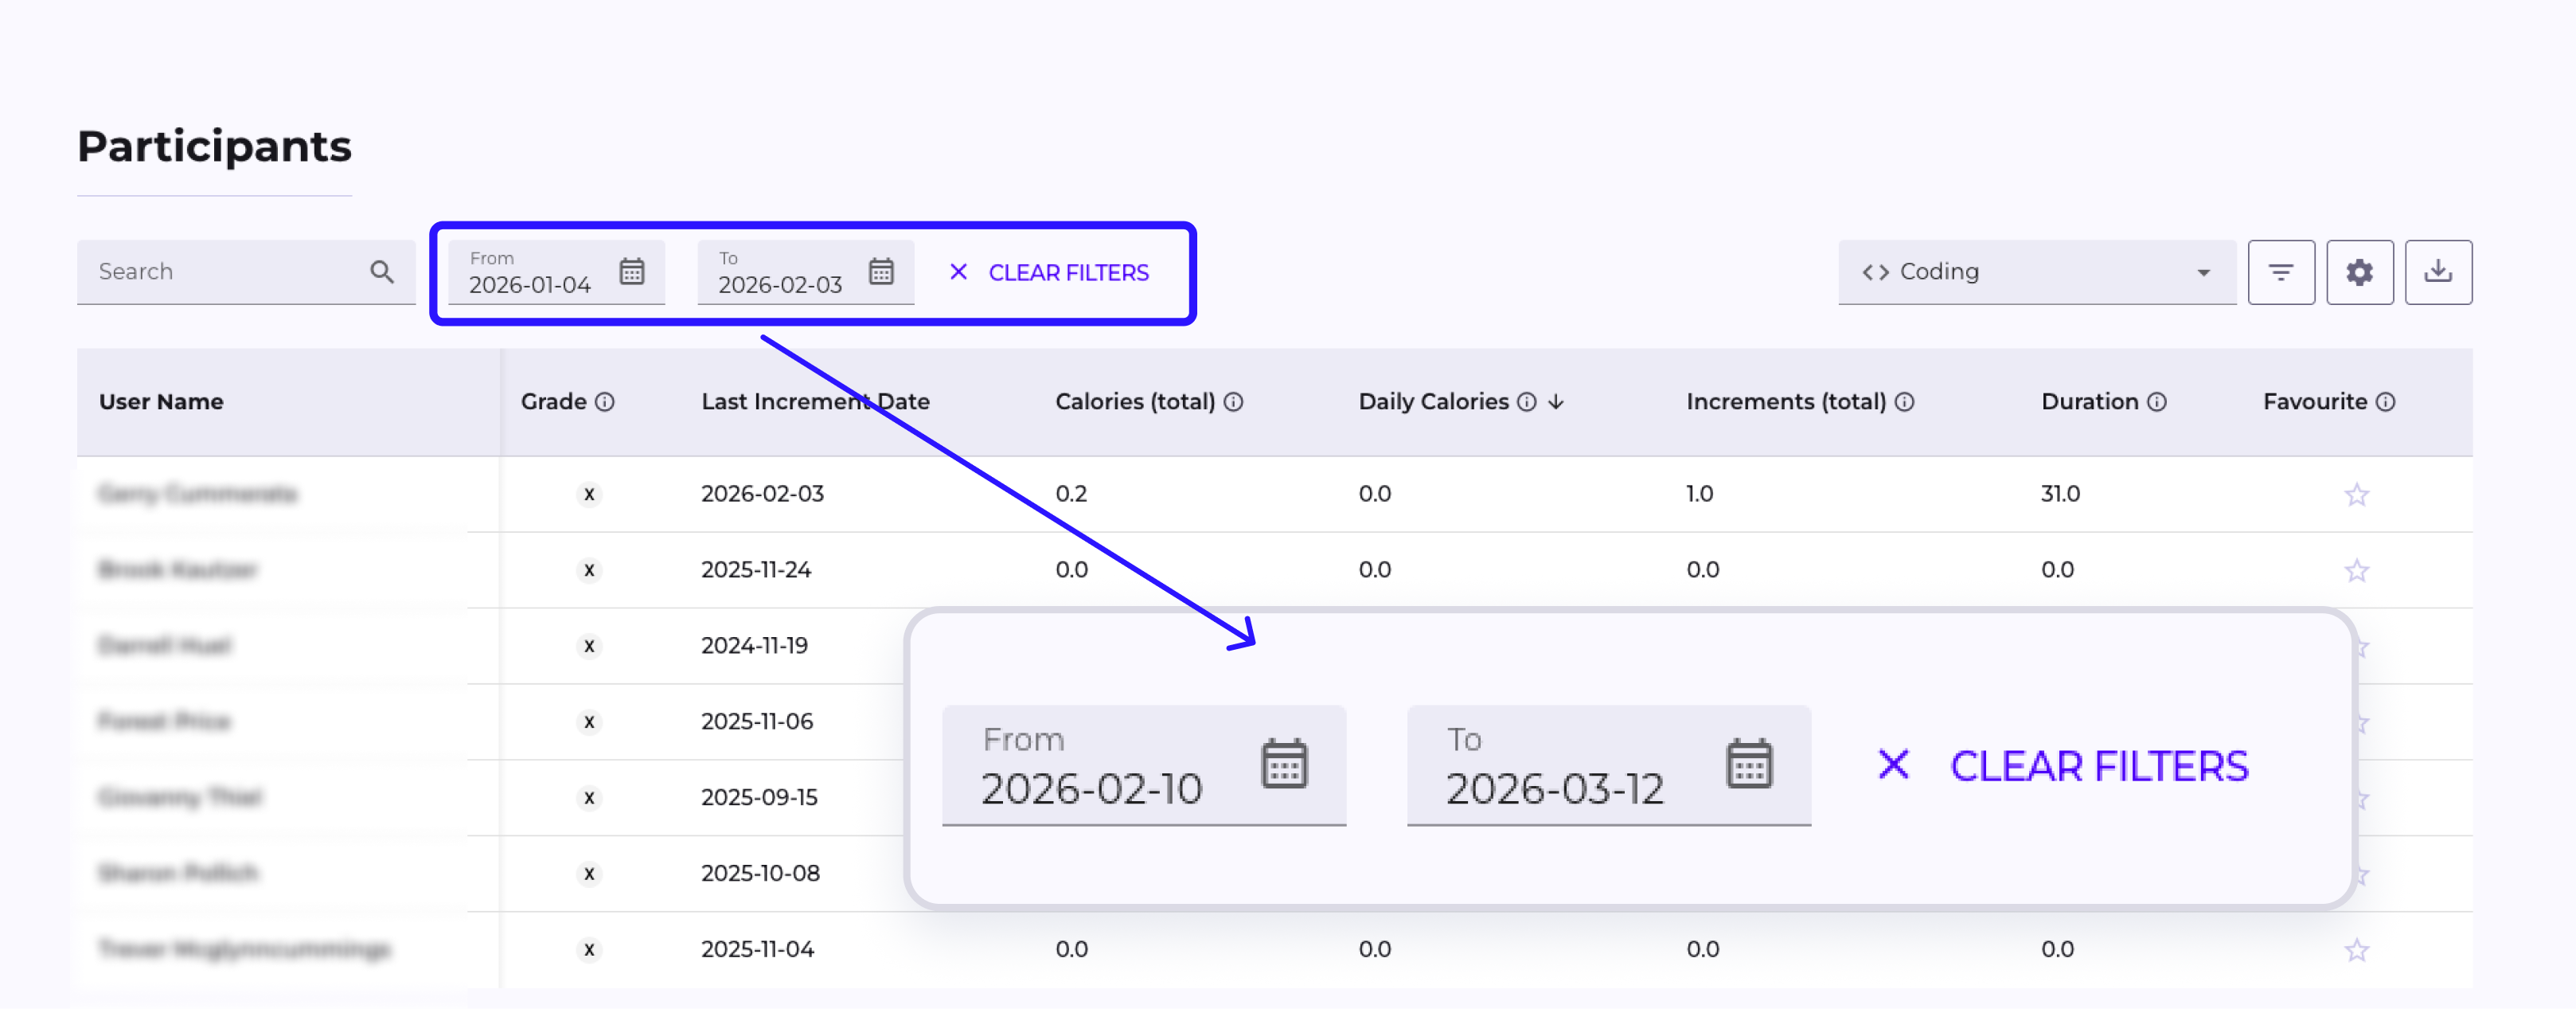
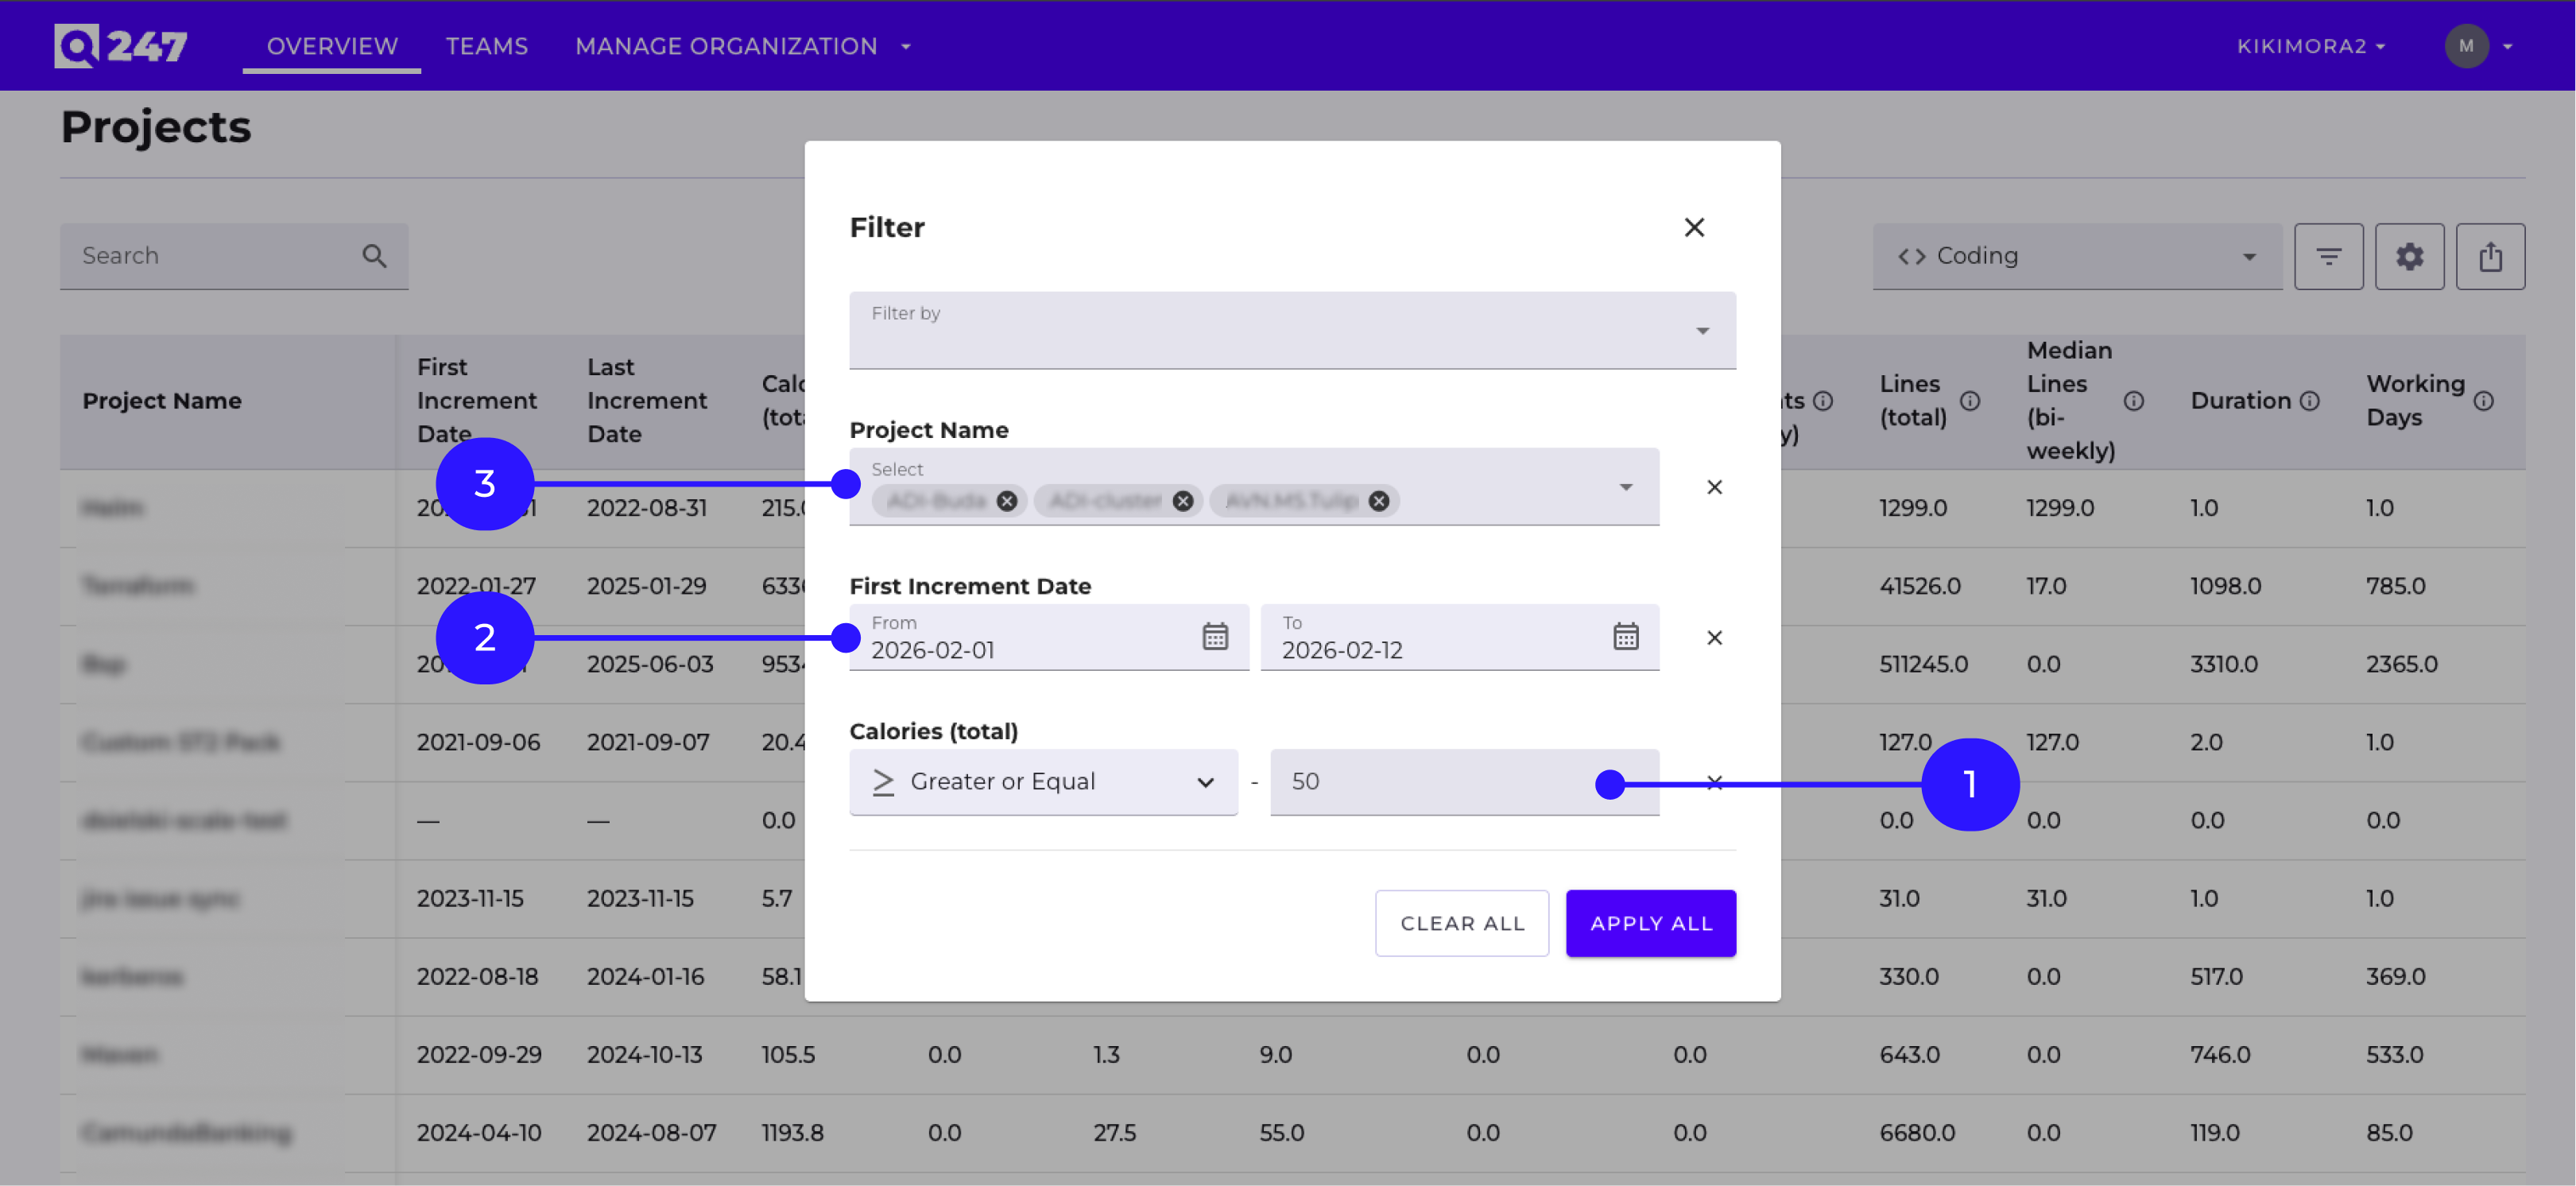
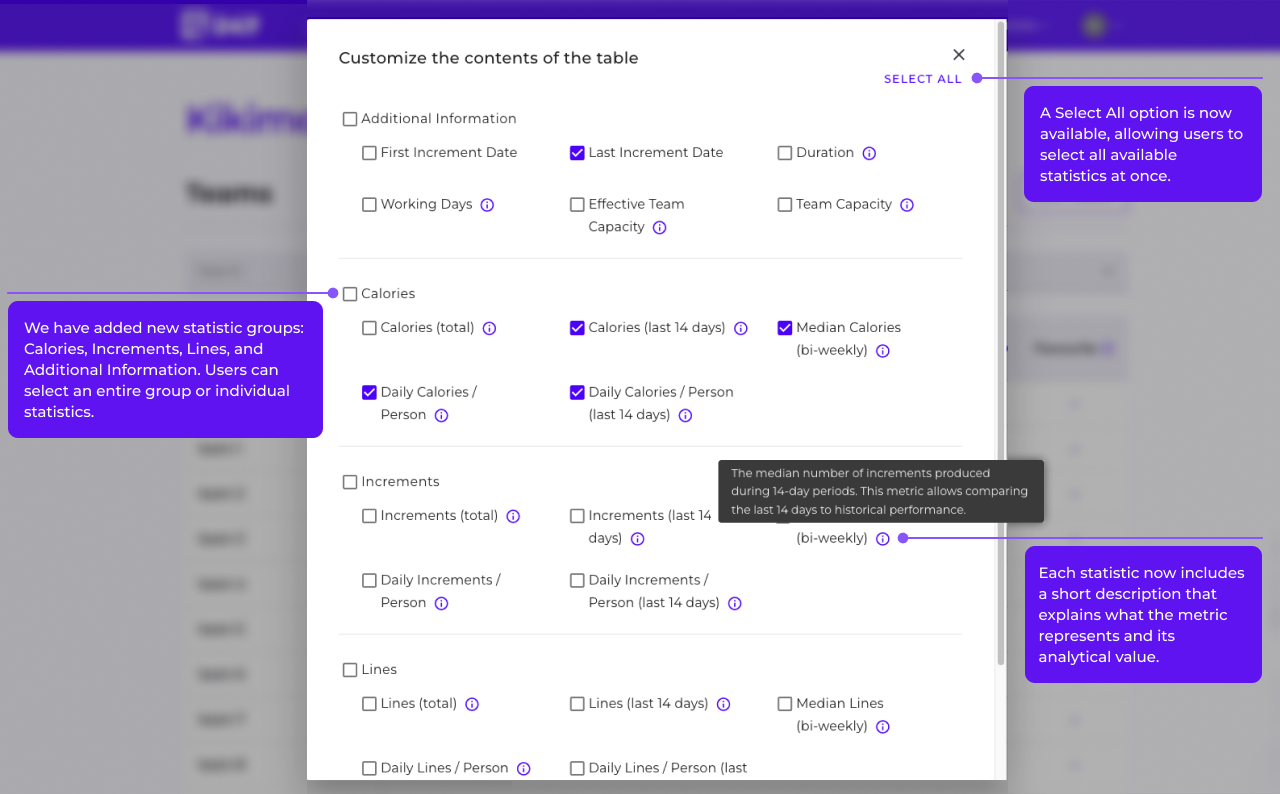
New "Others" Group Visualization in Participant Tables
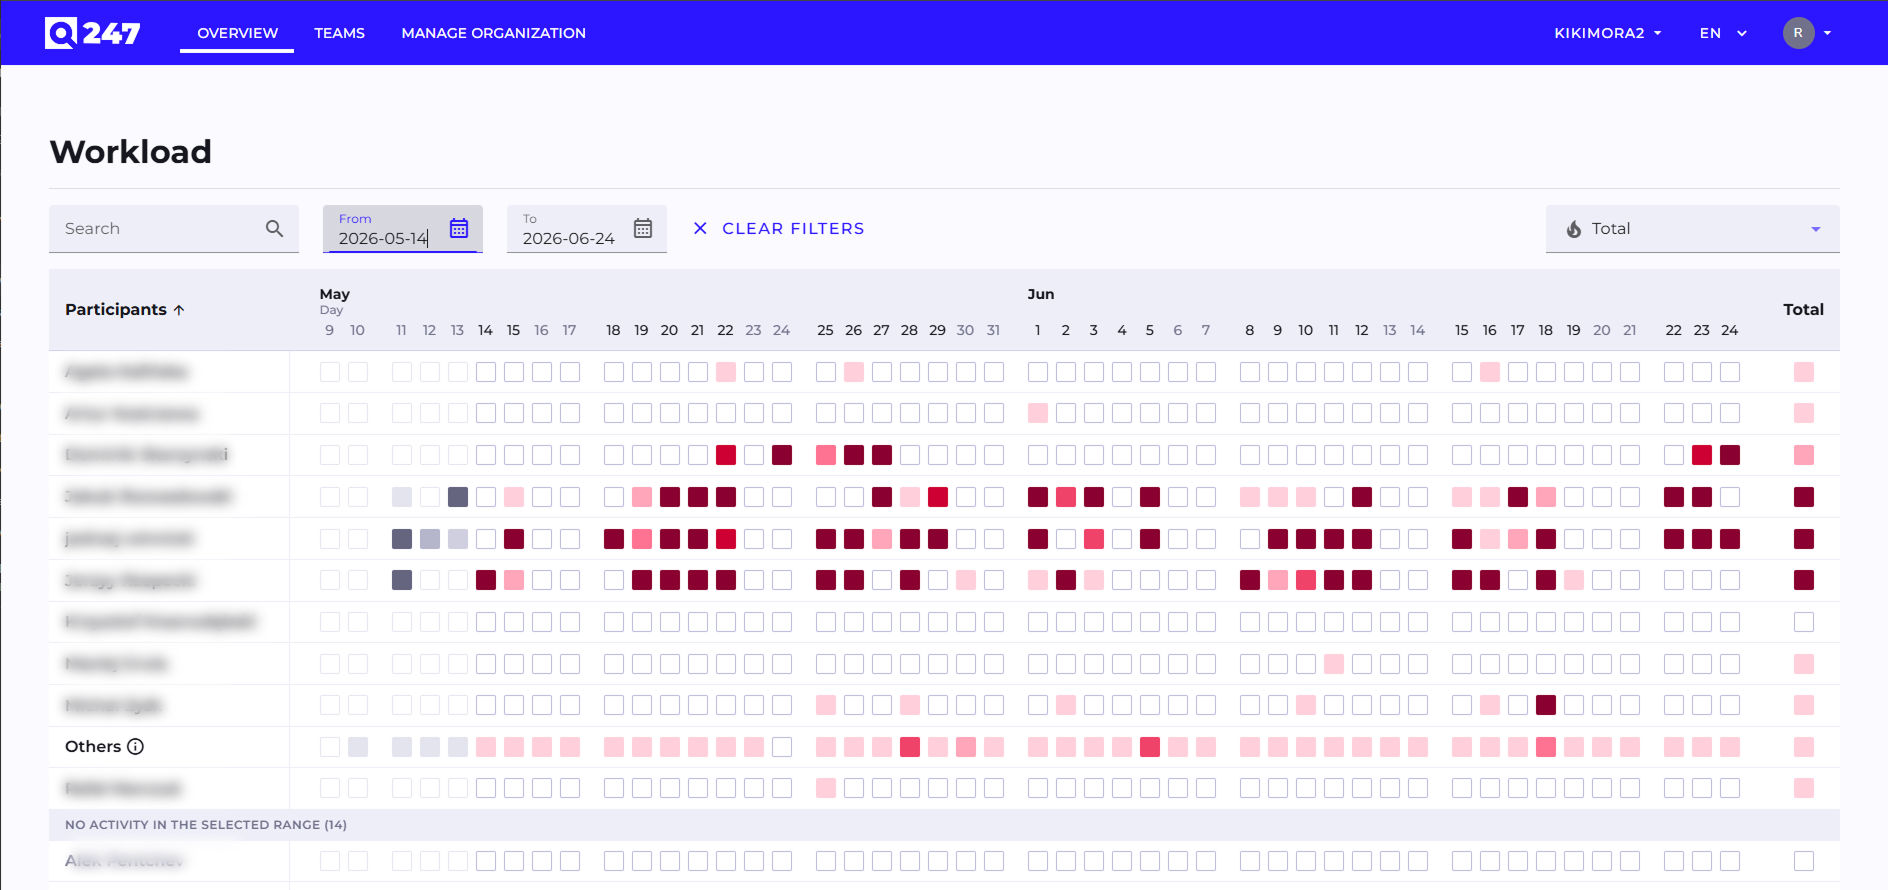
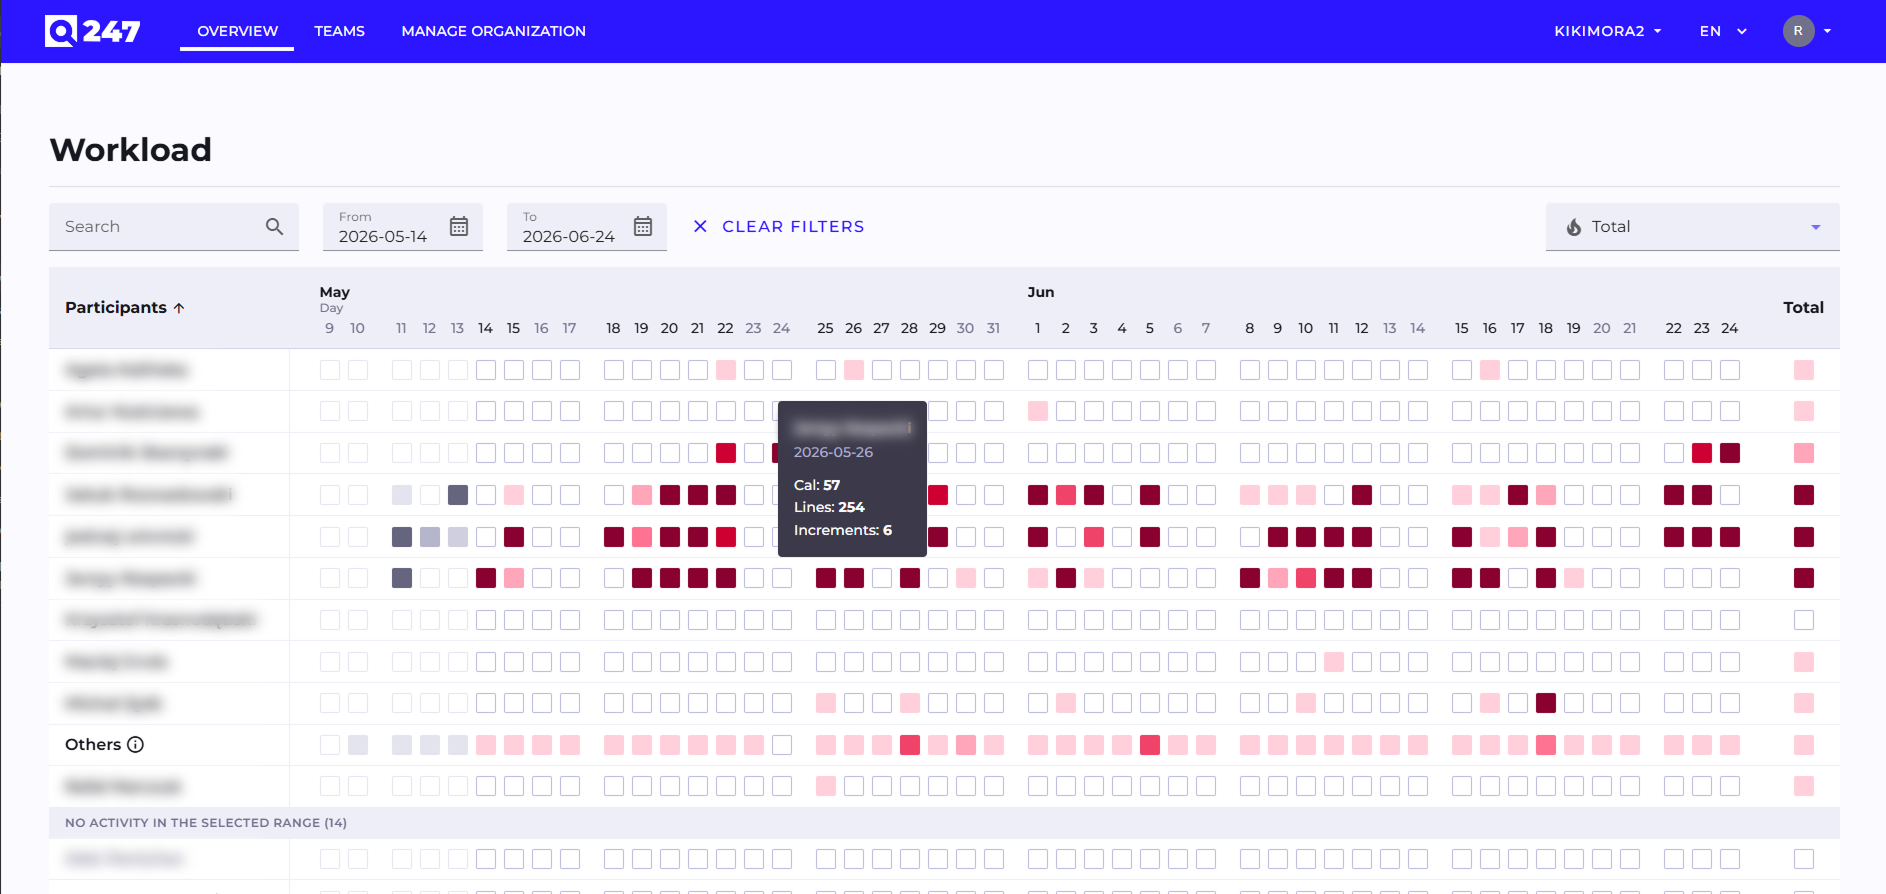
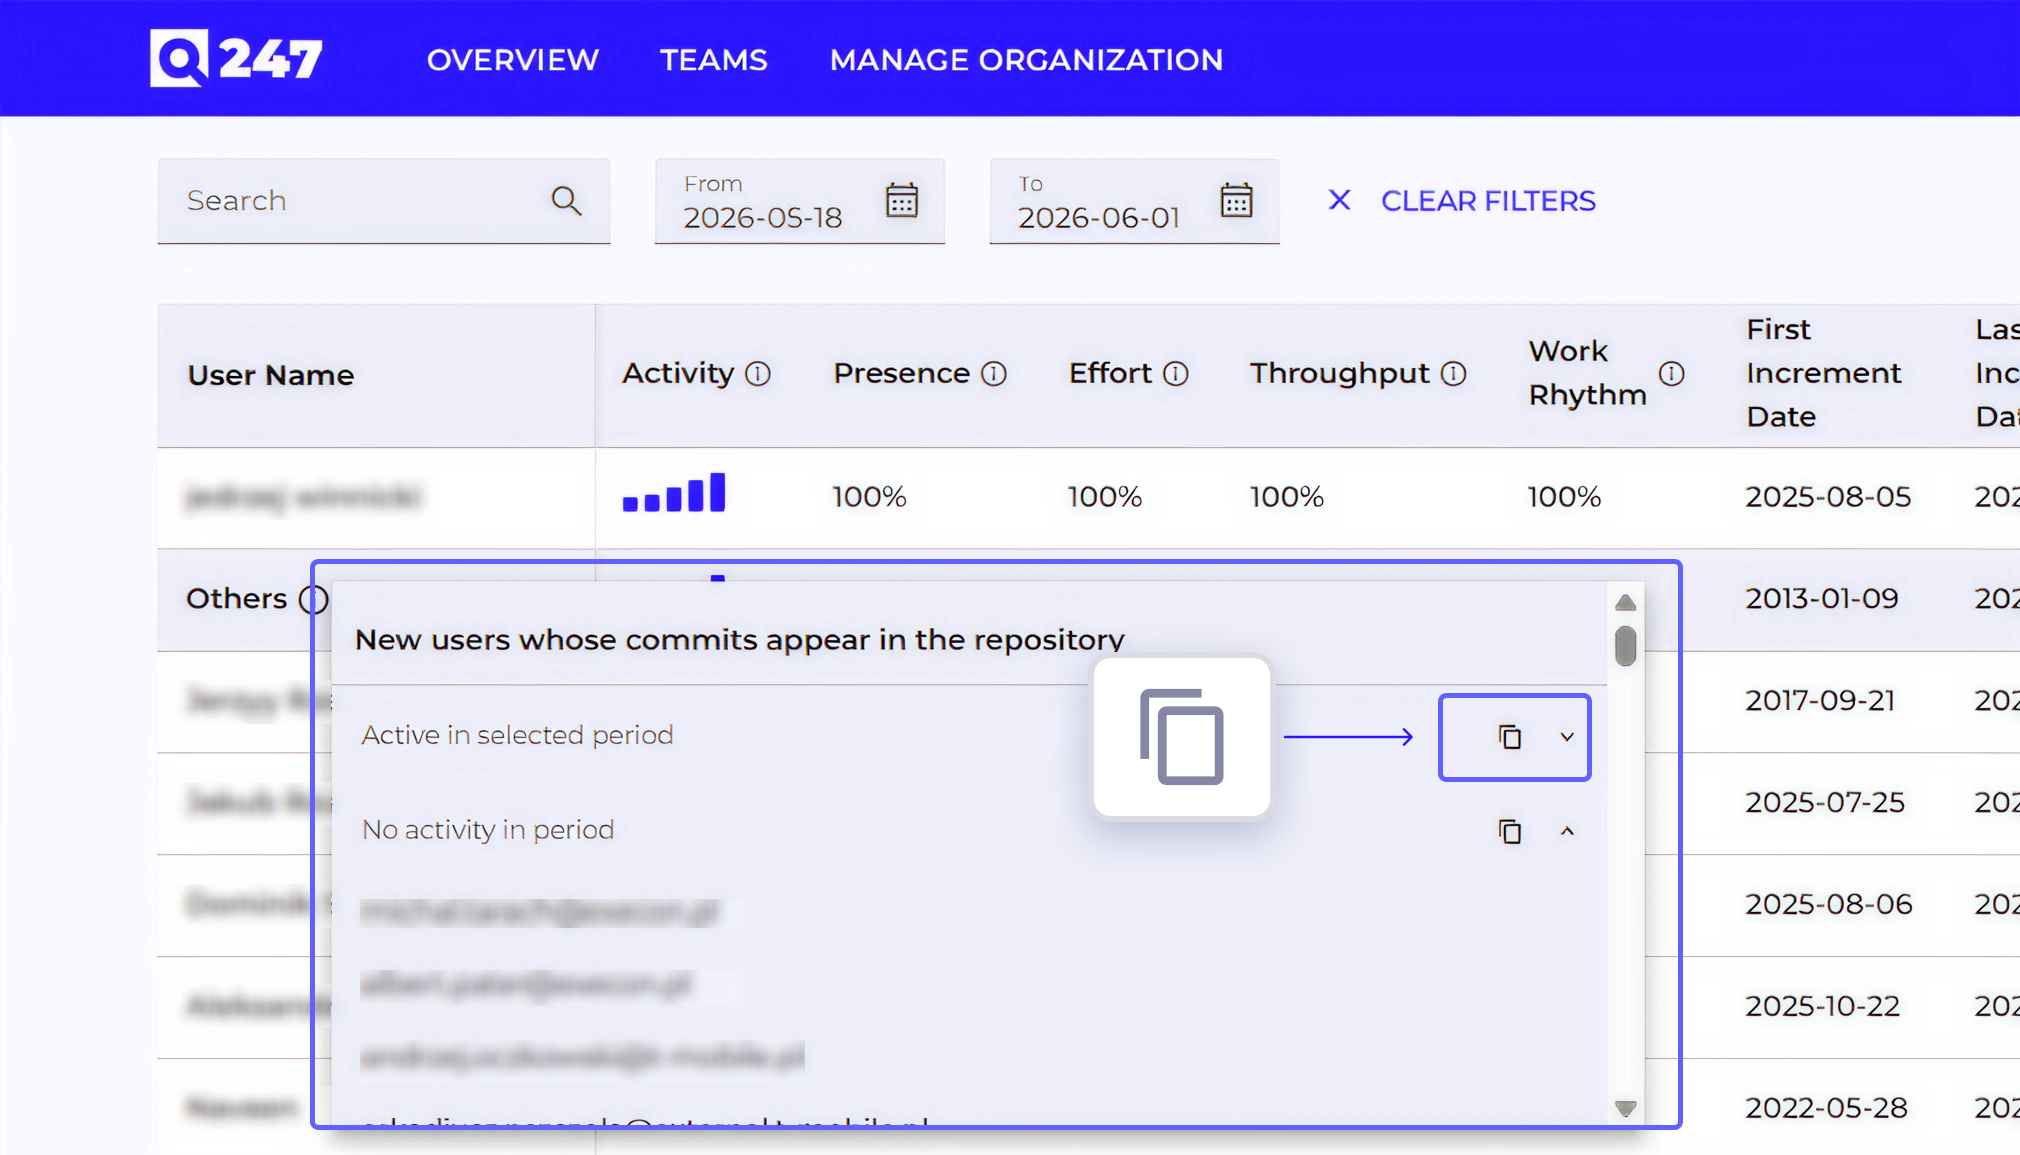
In the Participants table, once a date filter is applied, the "Others" group is now split into two sub-lists: participants who made at least one increment during the selected period, and those who had no activity in that time. Next to each sub-group's header there is a button to copy the list of email addresses to the clipboard (one address per line), making it easy to quickly extract the set of active or inactive people for further communication outside Q247.
The expandable infotip for the "Others" group has also been visually unified with the Design System mockup — consistent colors, backgrounds, font, and divider.
Improvements
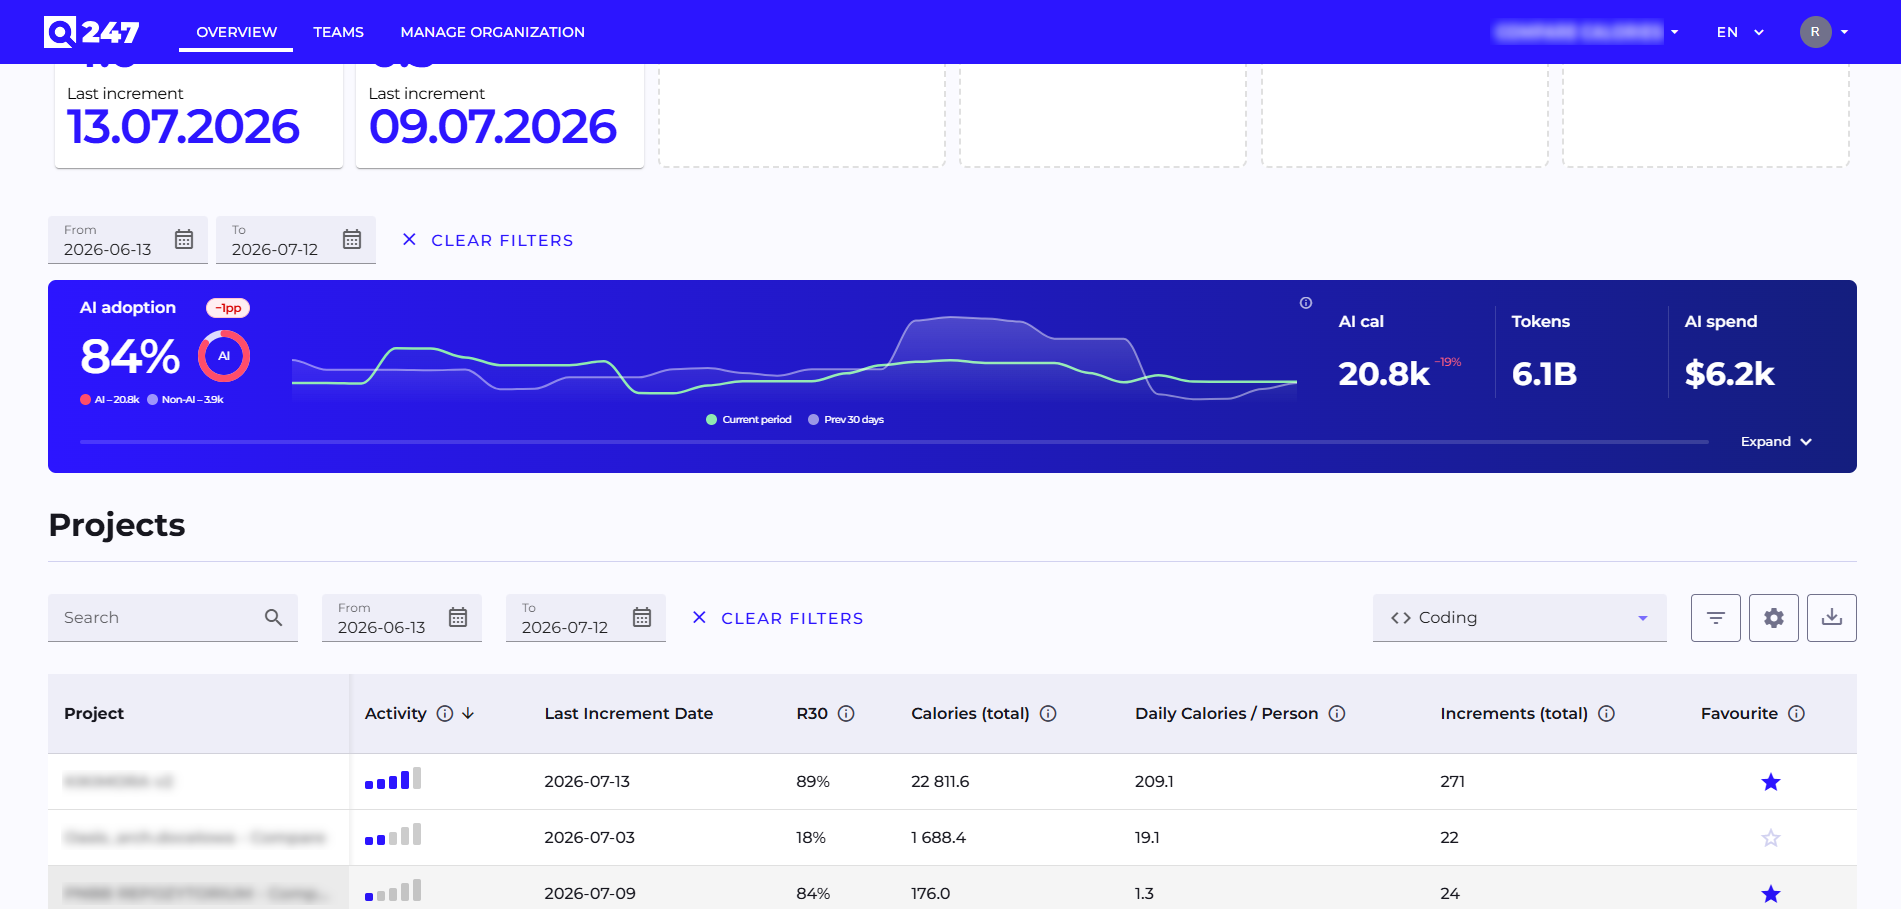
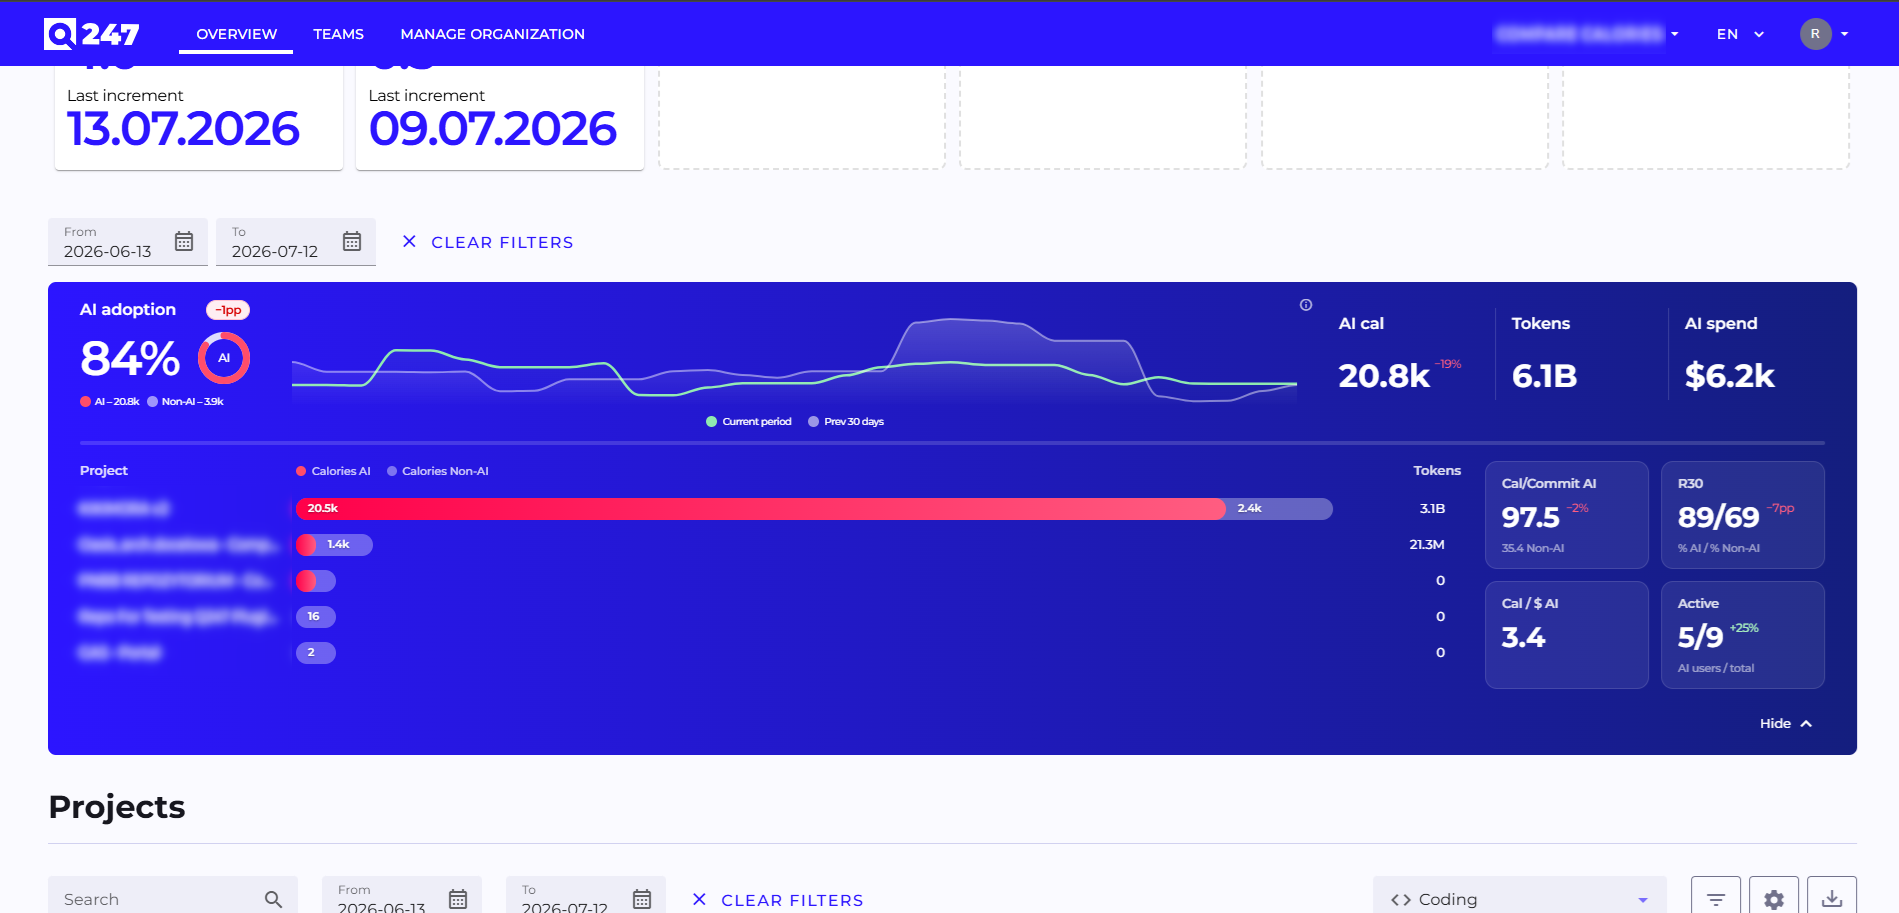
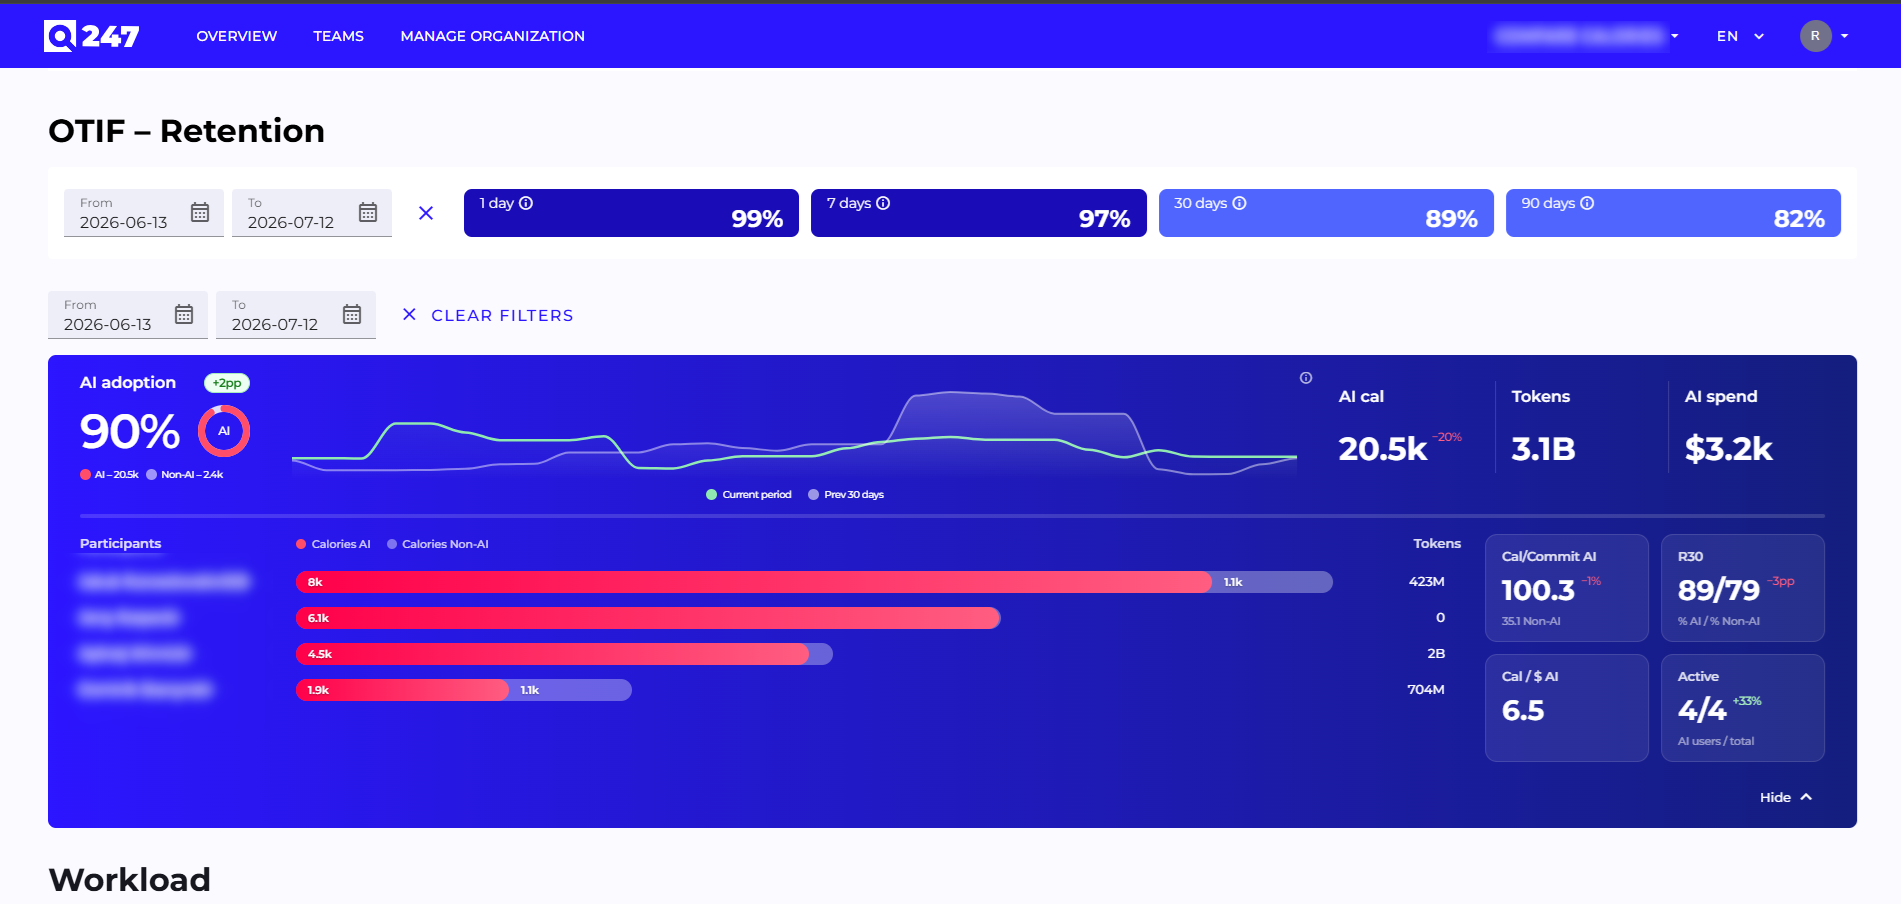
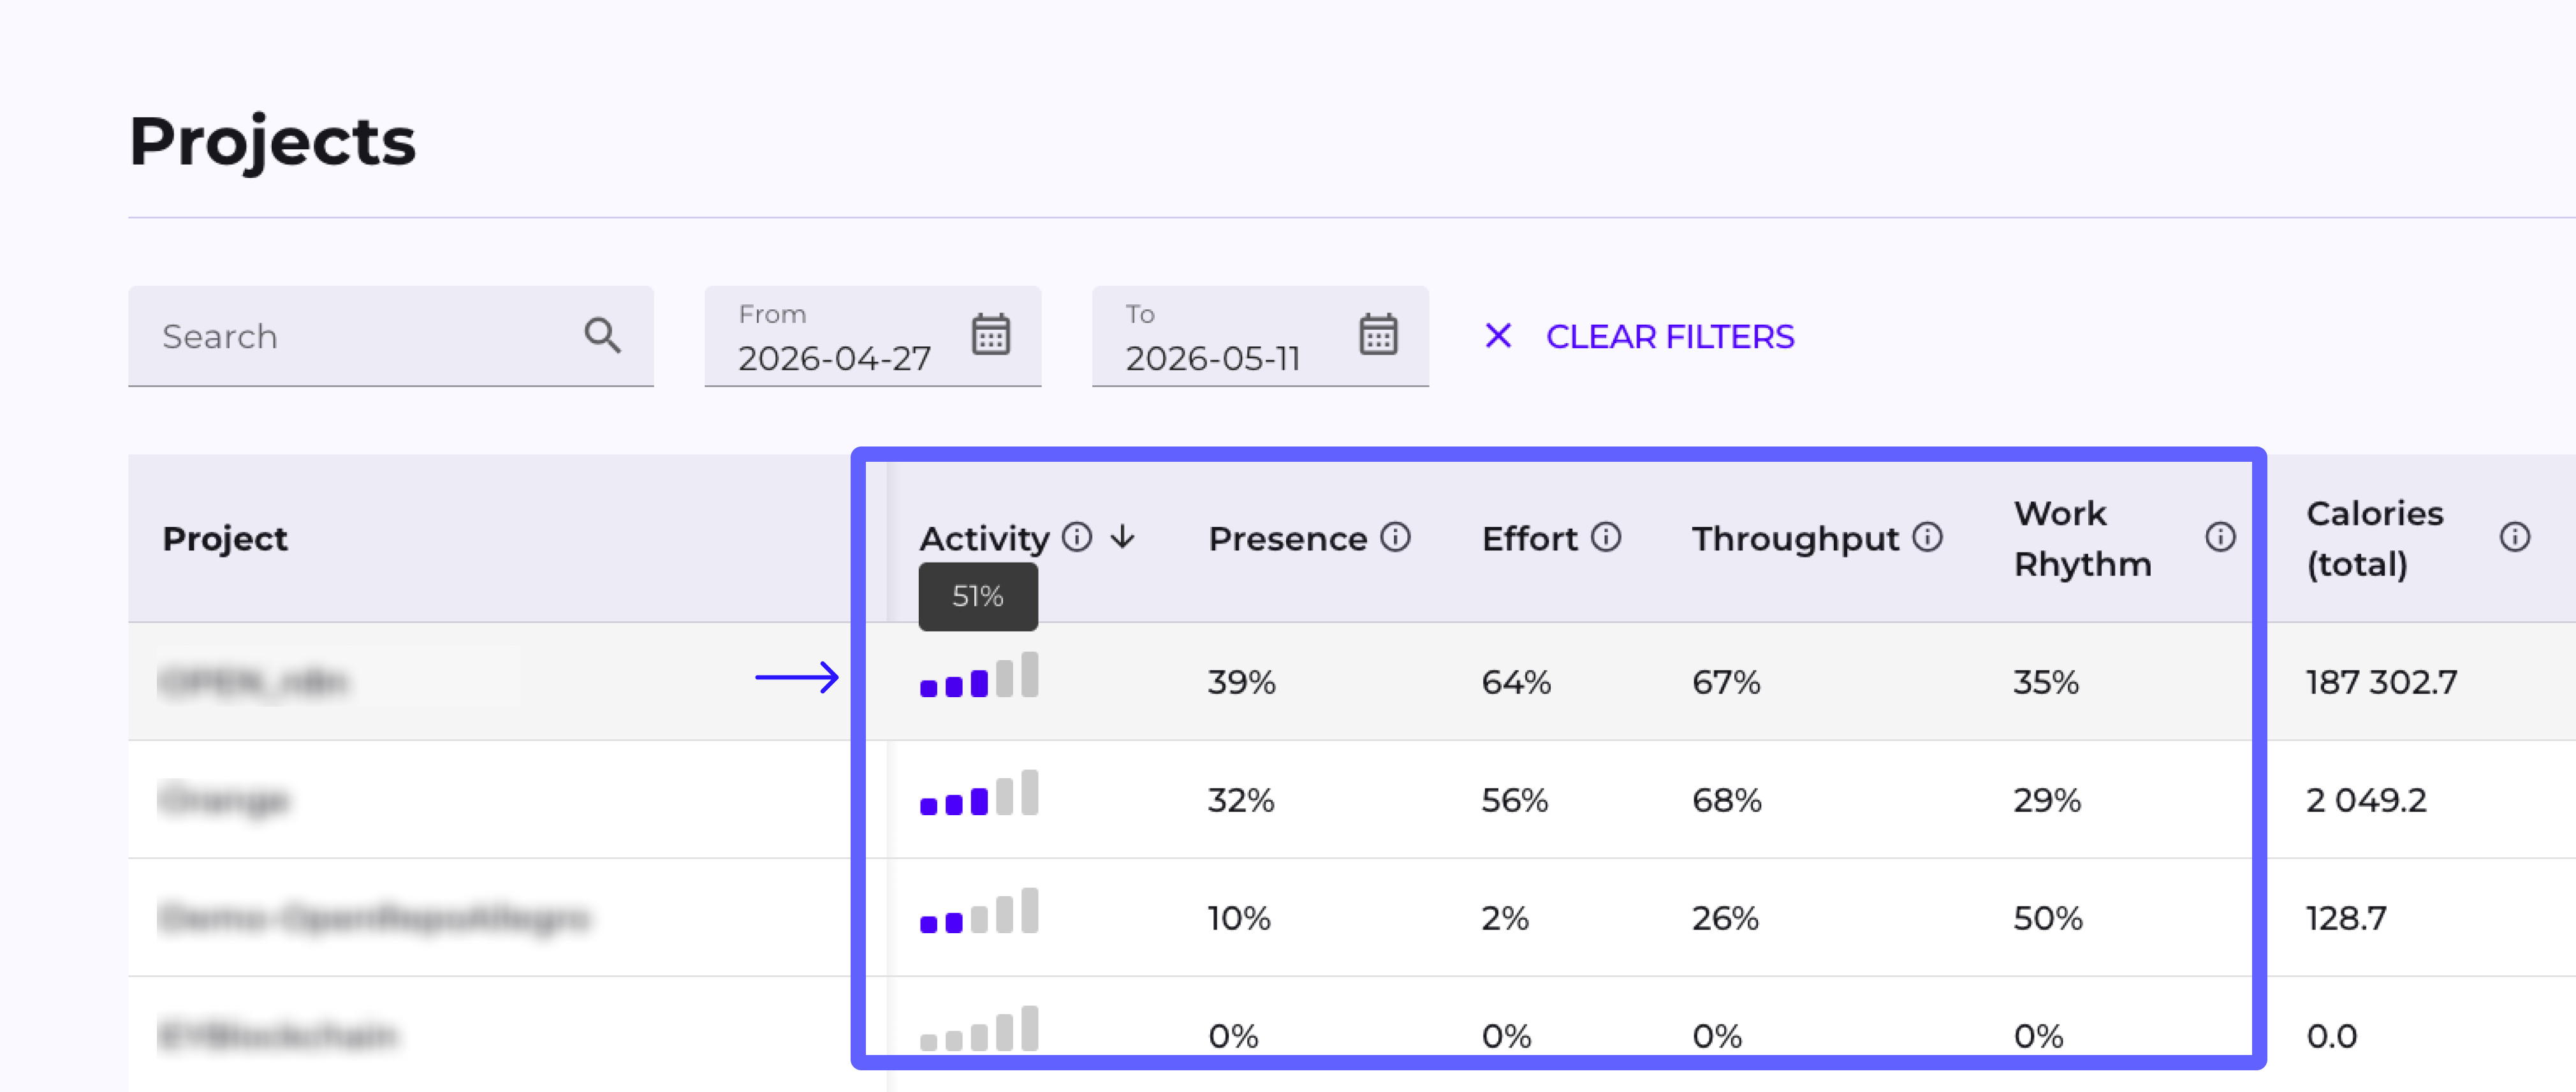
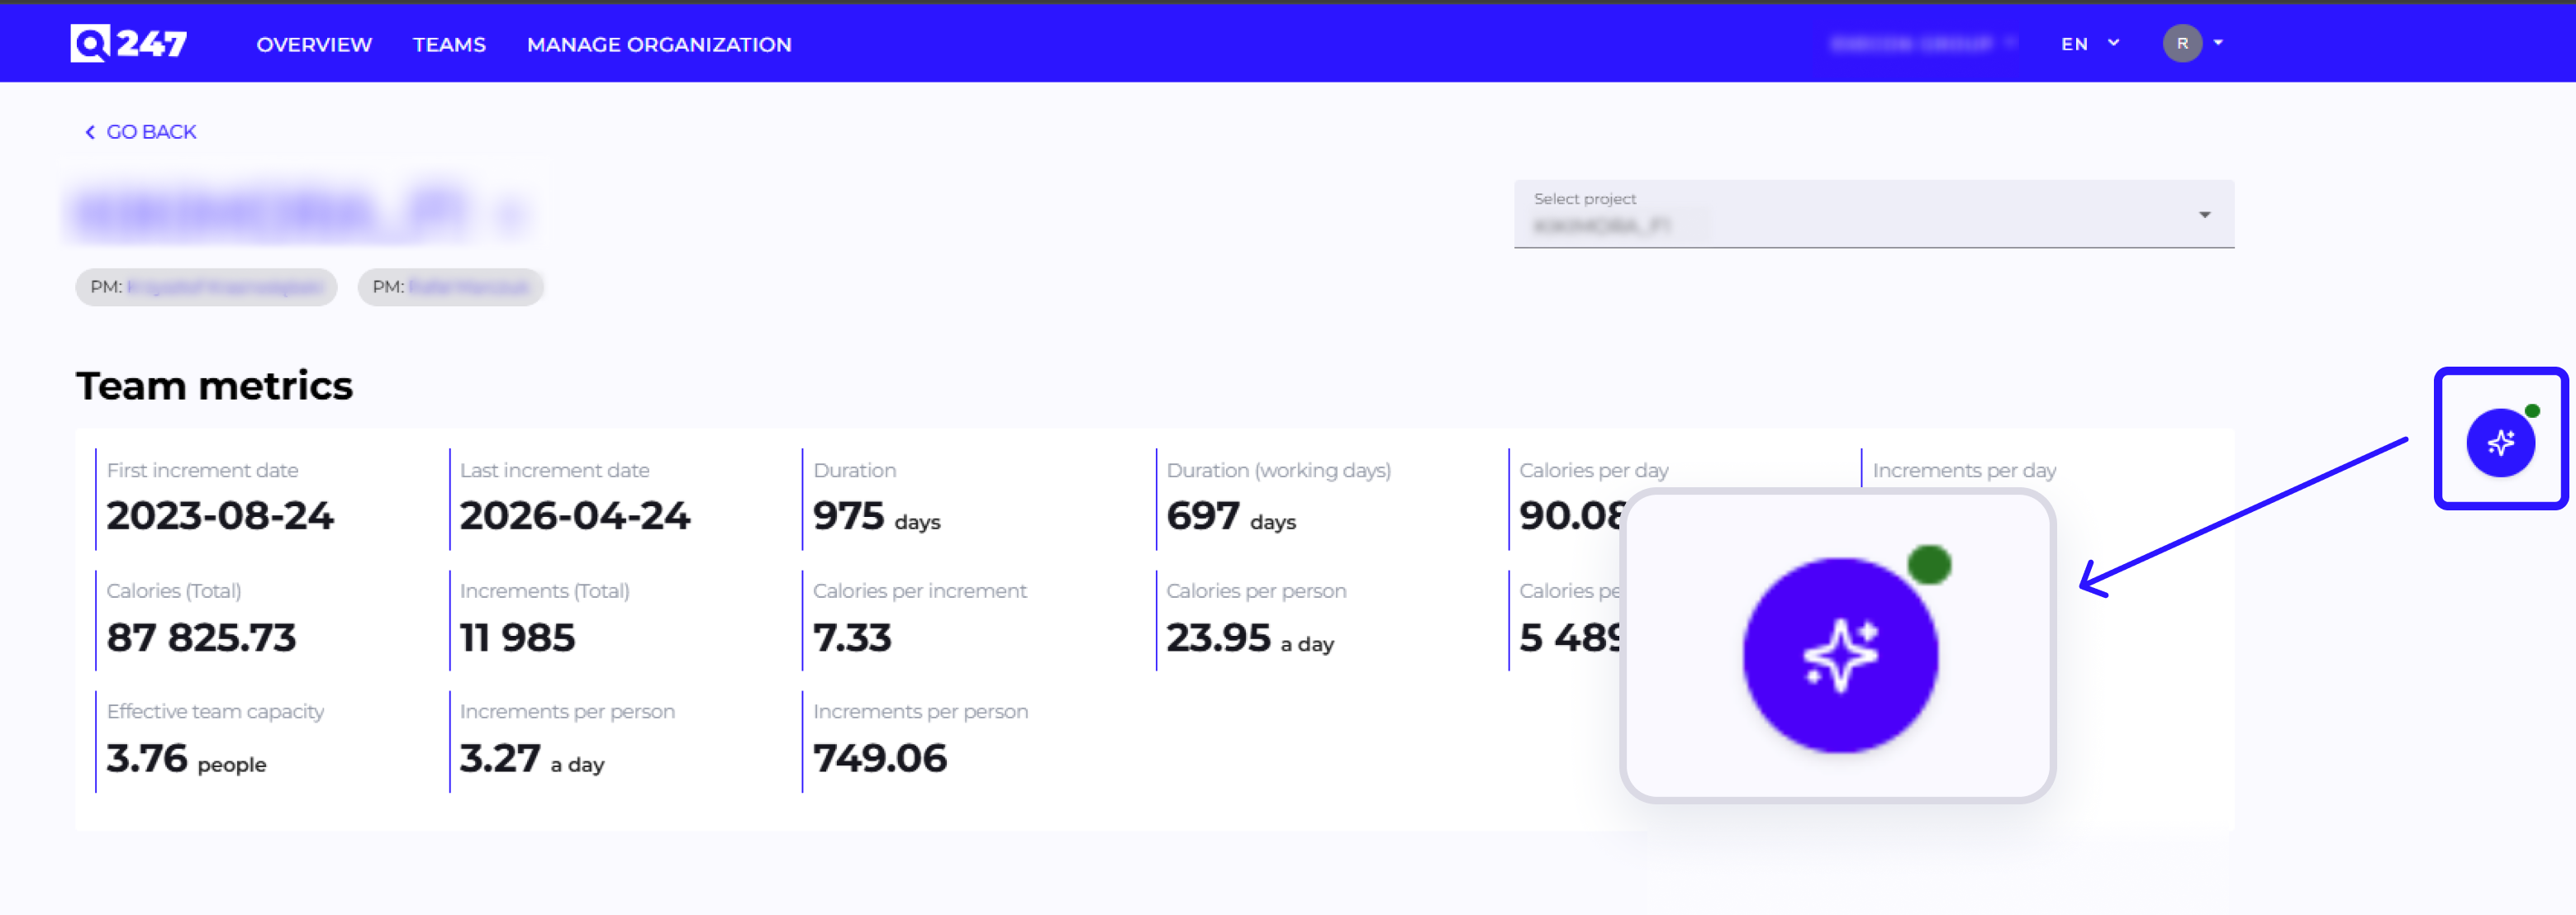
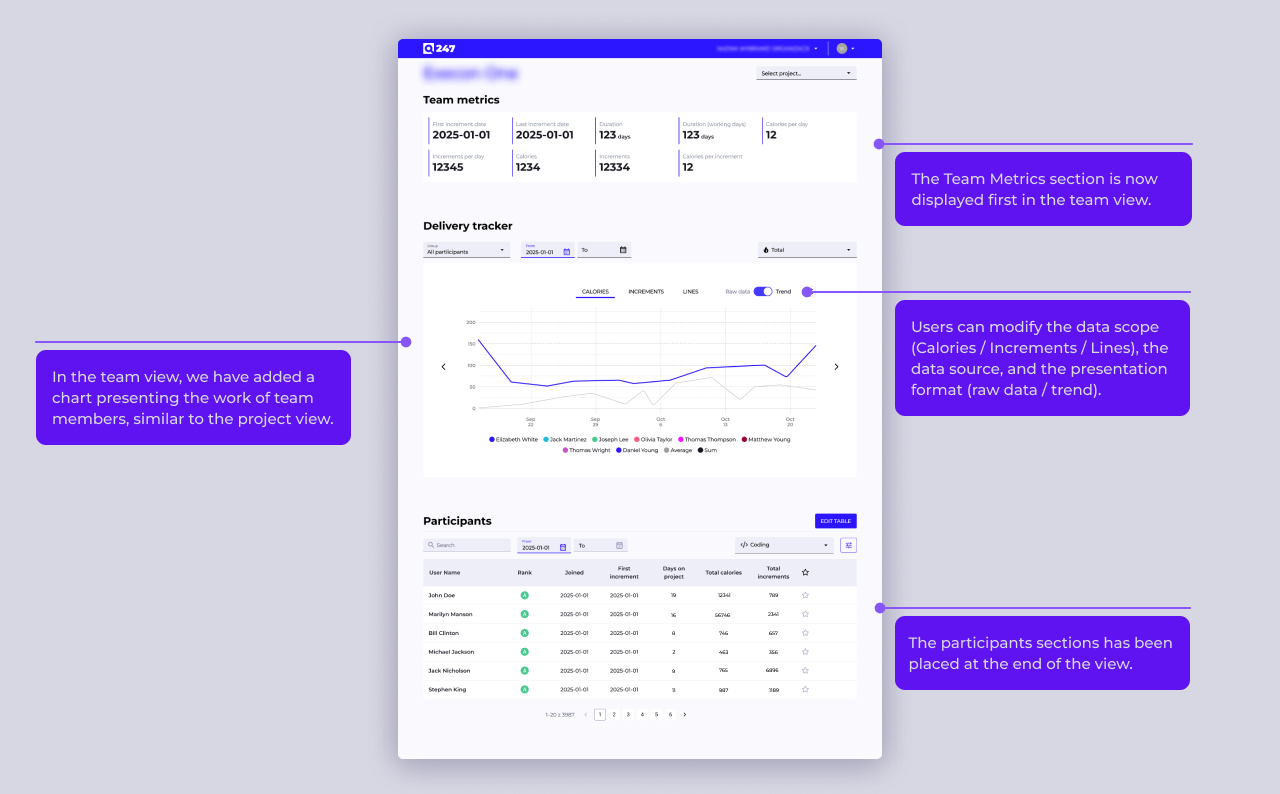
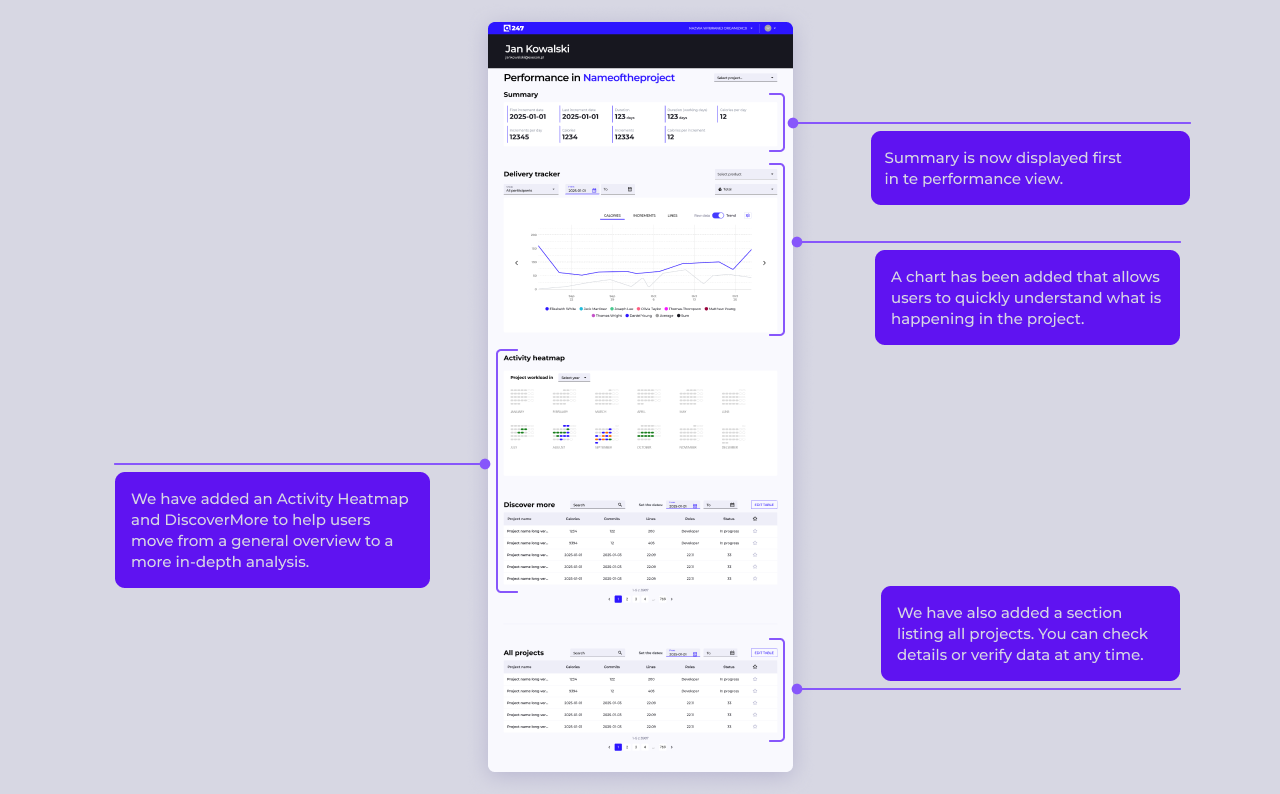
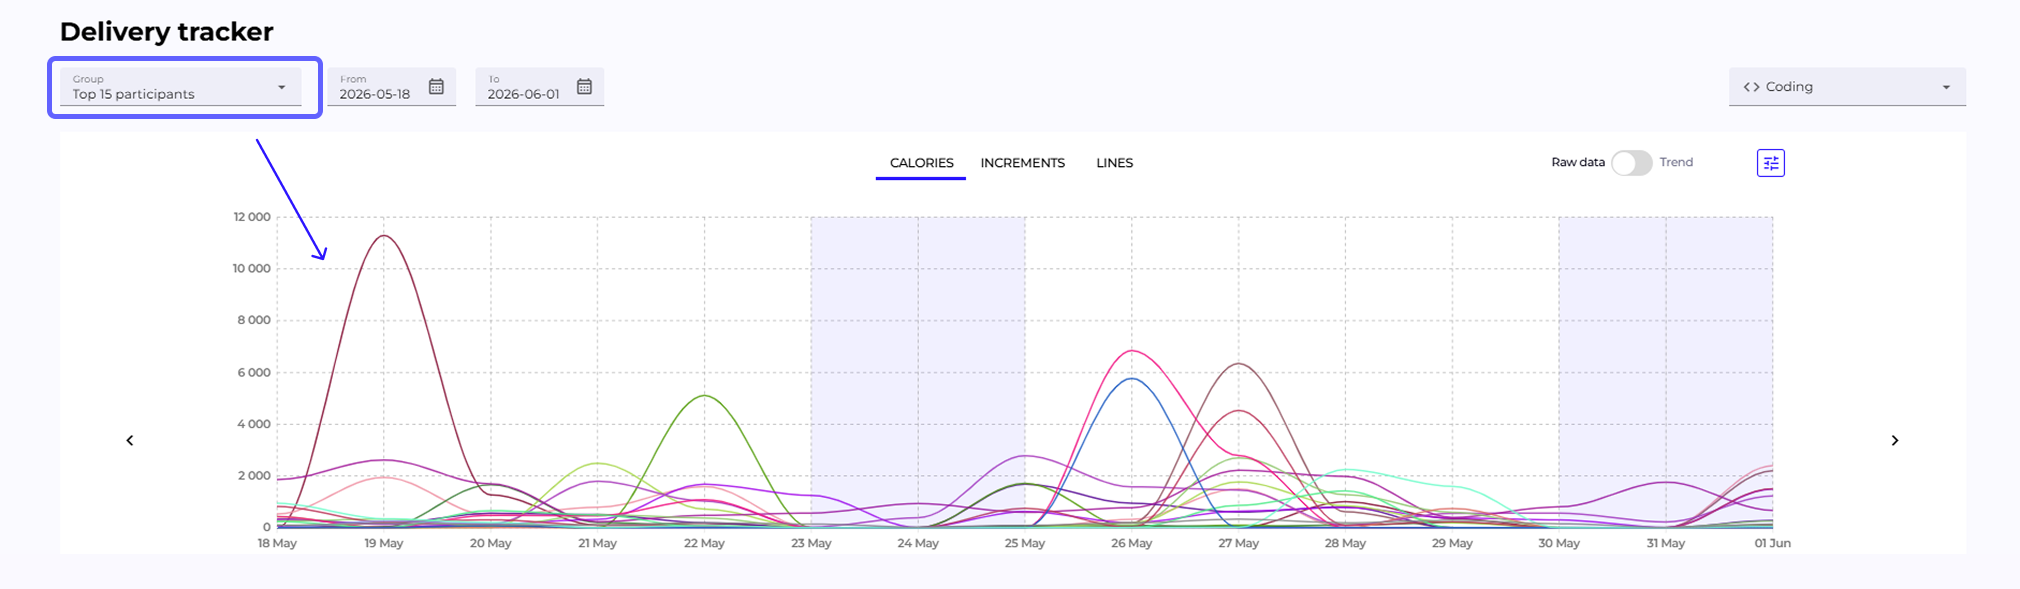
Average by Default on the Delivery Tracker Chart — Team and Project Views
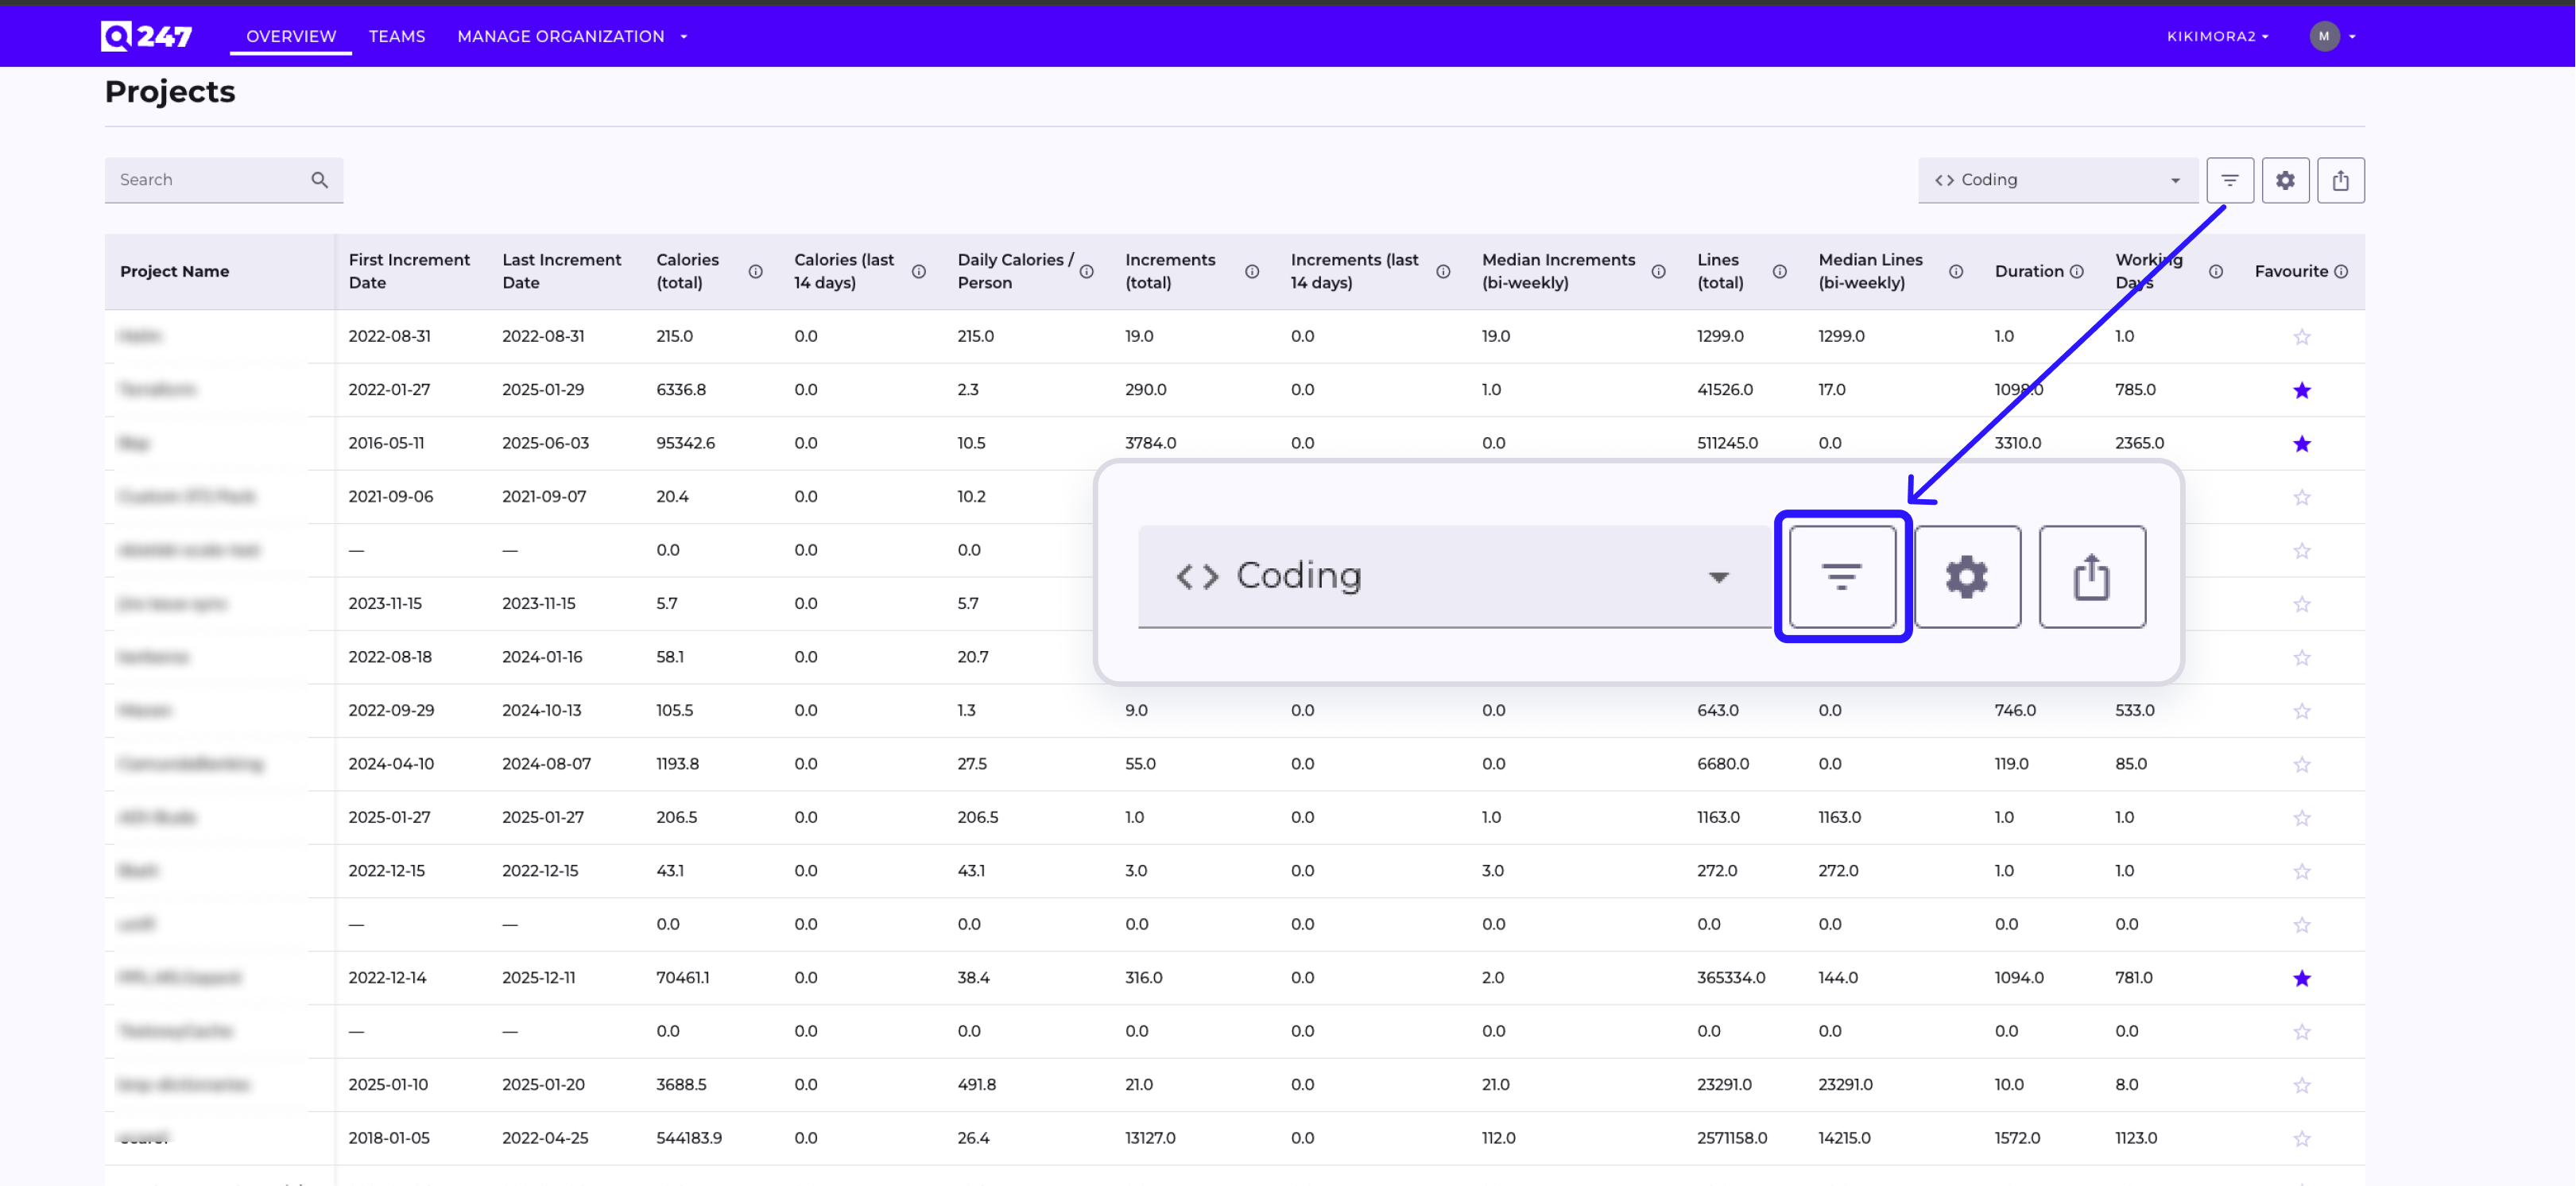
Upon entering the project and team views, the chart shows the average number of calories and the total calories of all participants. The participant range selection dropdown on the Delivery Tracker chart (Project and Team views) changes the "Top 5 participant" option to "Top 15 participant" — selected by the largest total number of calories in the current date range.
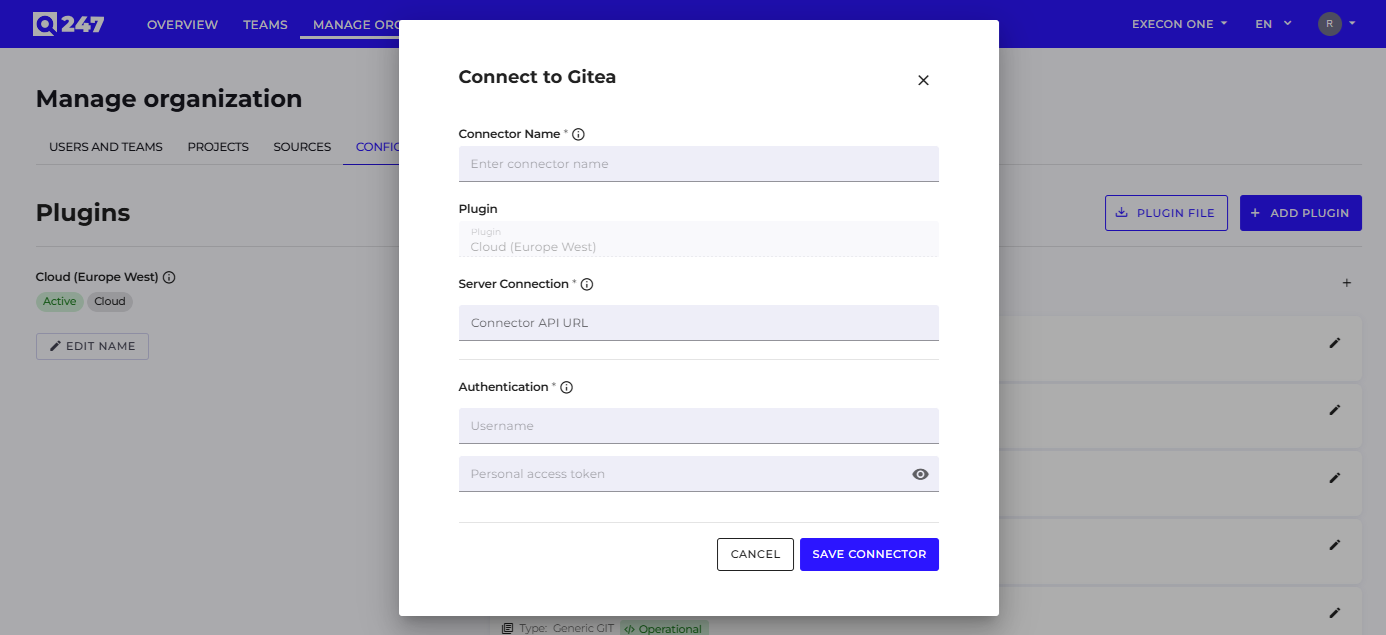
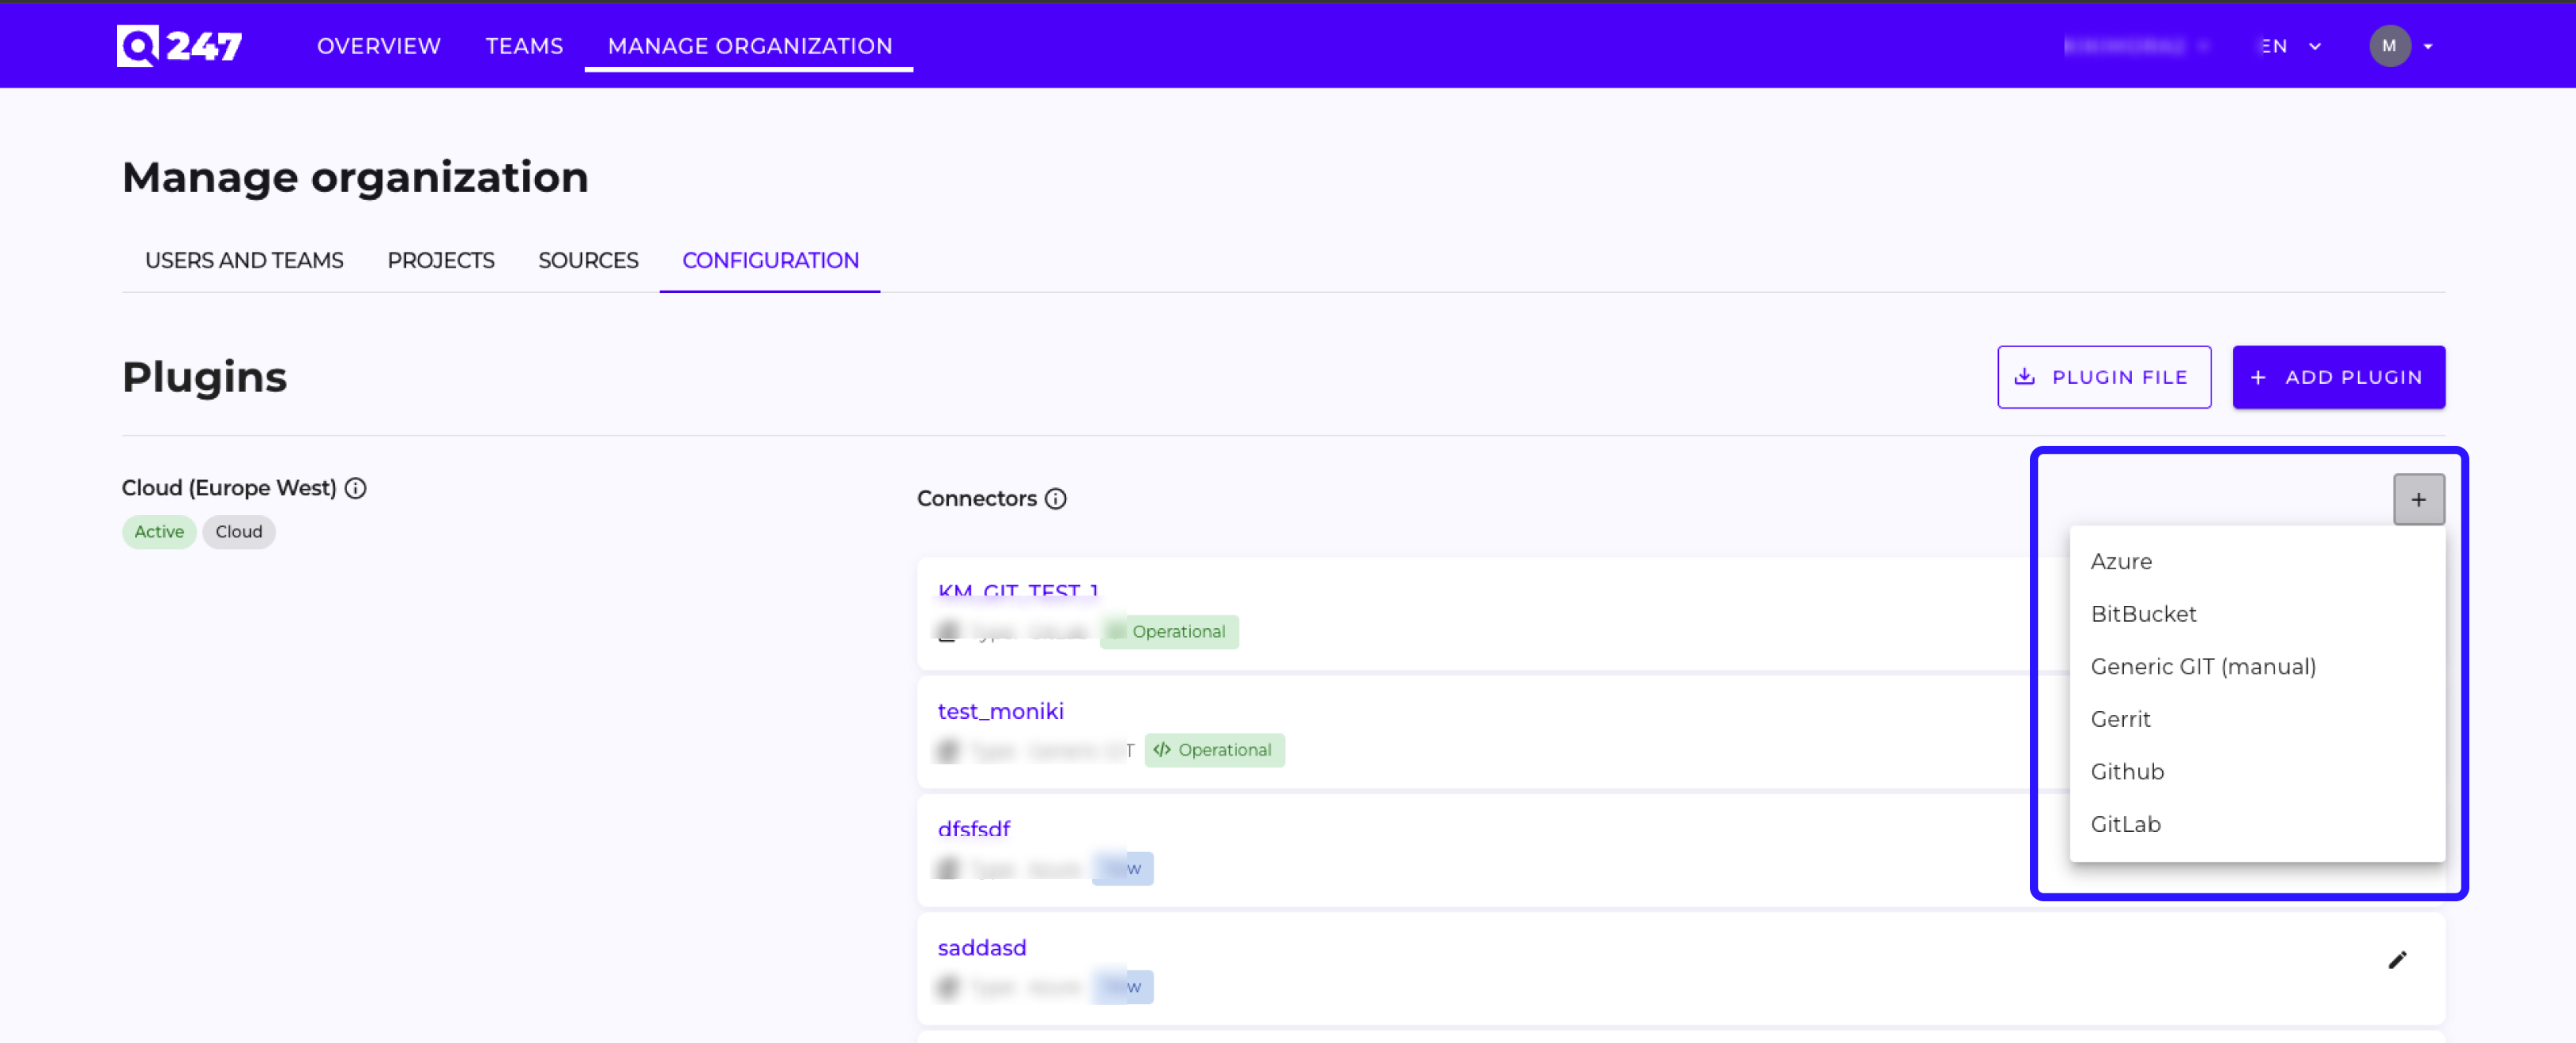
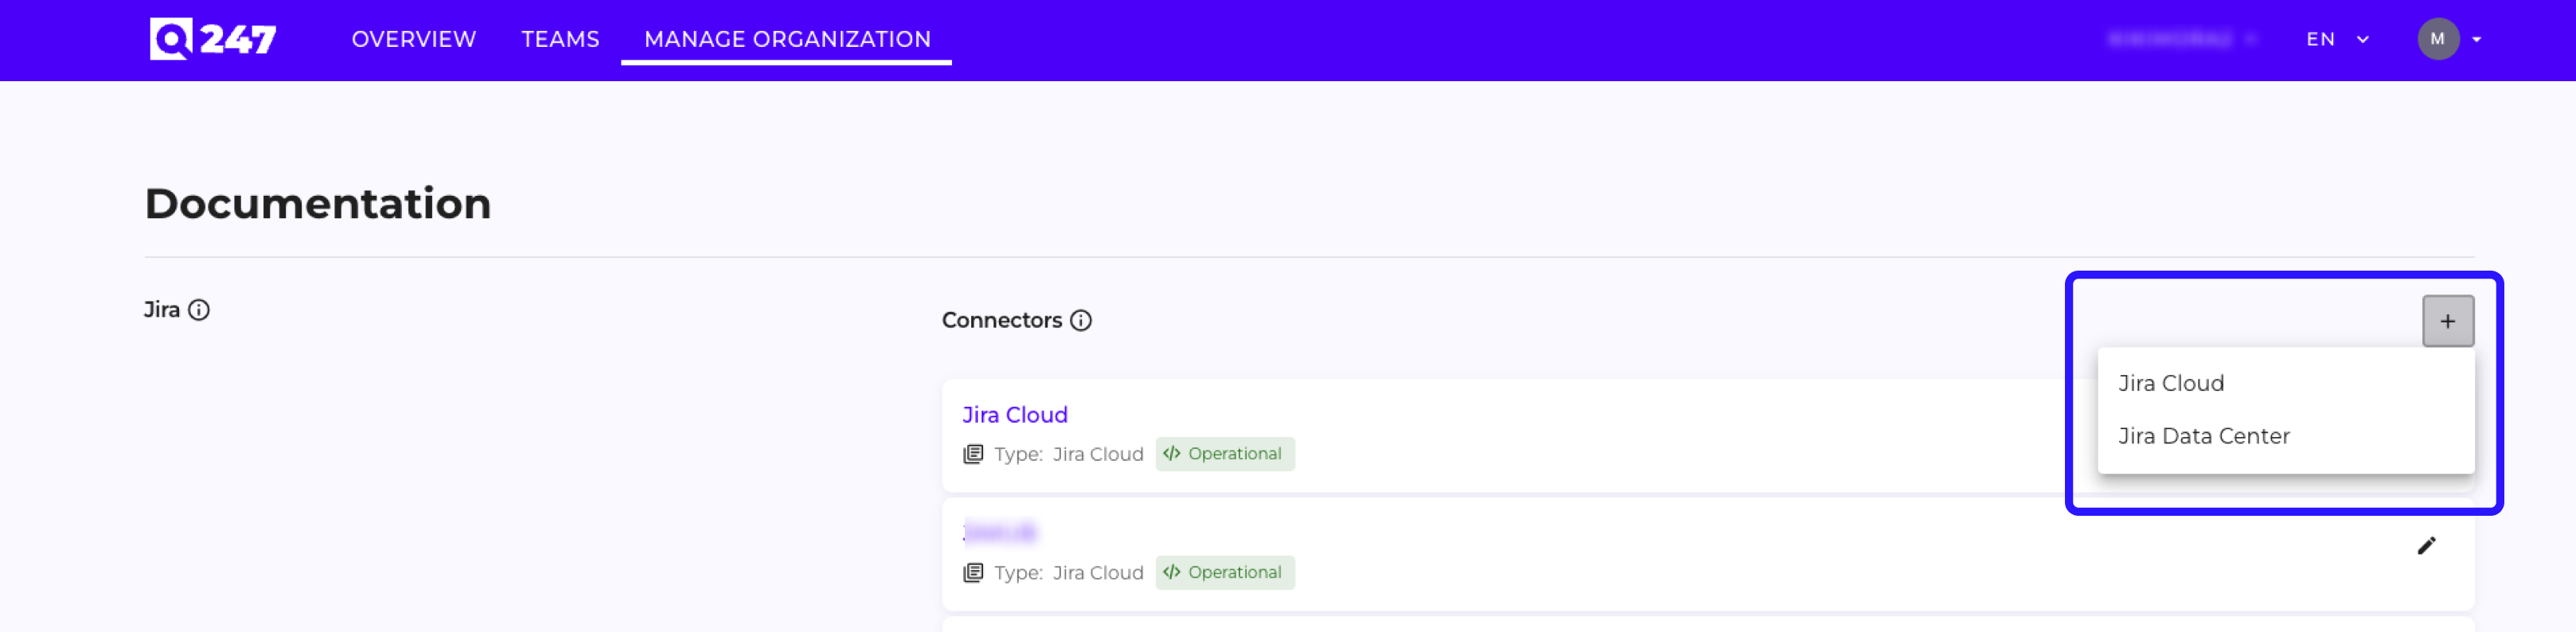
Plugin Editing in Manage Organization
The name of an existing plugin can now be edited — previously it was set only at creation. The form for adding a new plugin has been simplified by removing fields that were not required for configuration.
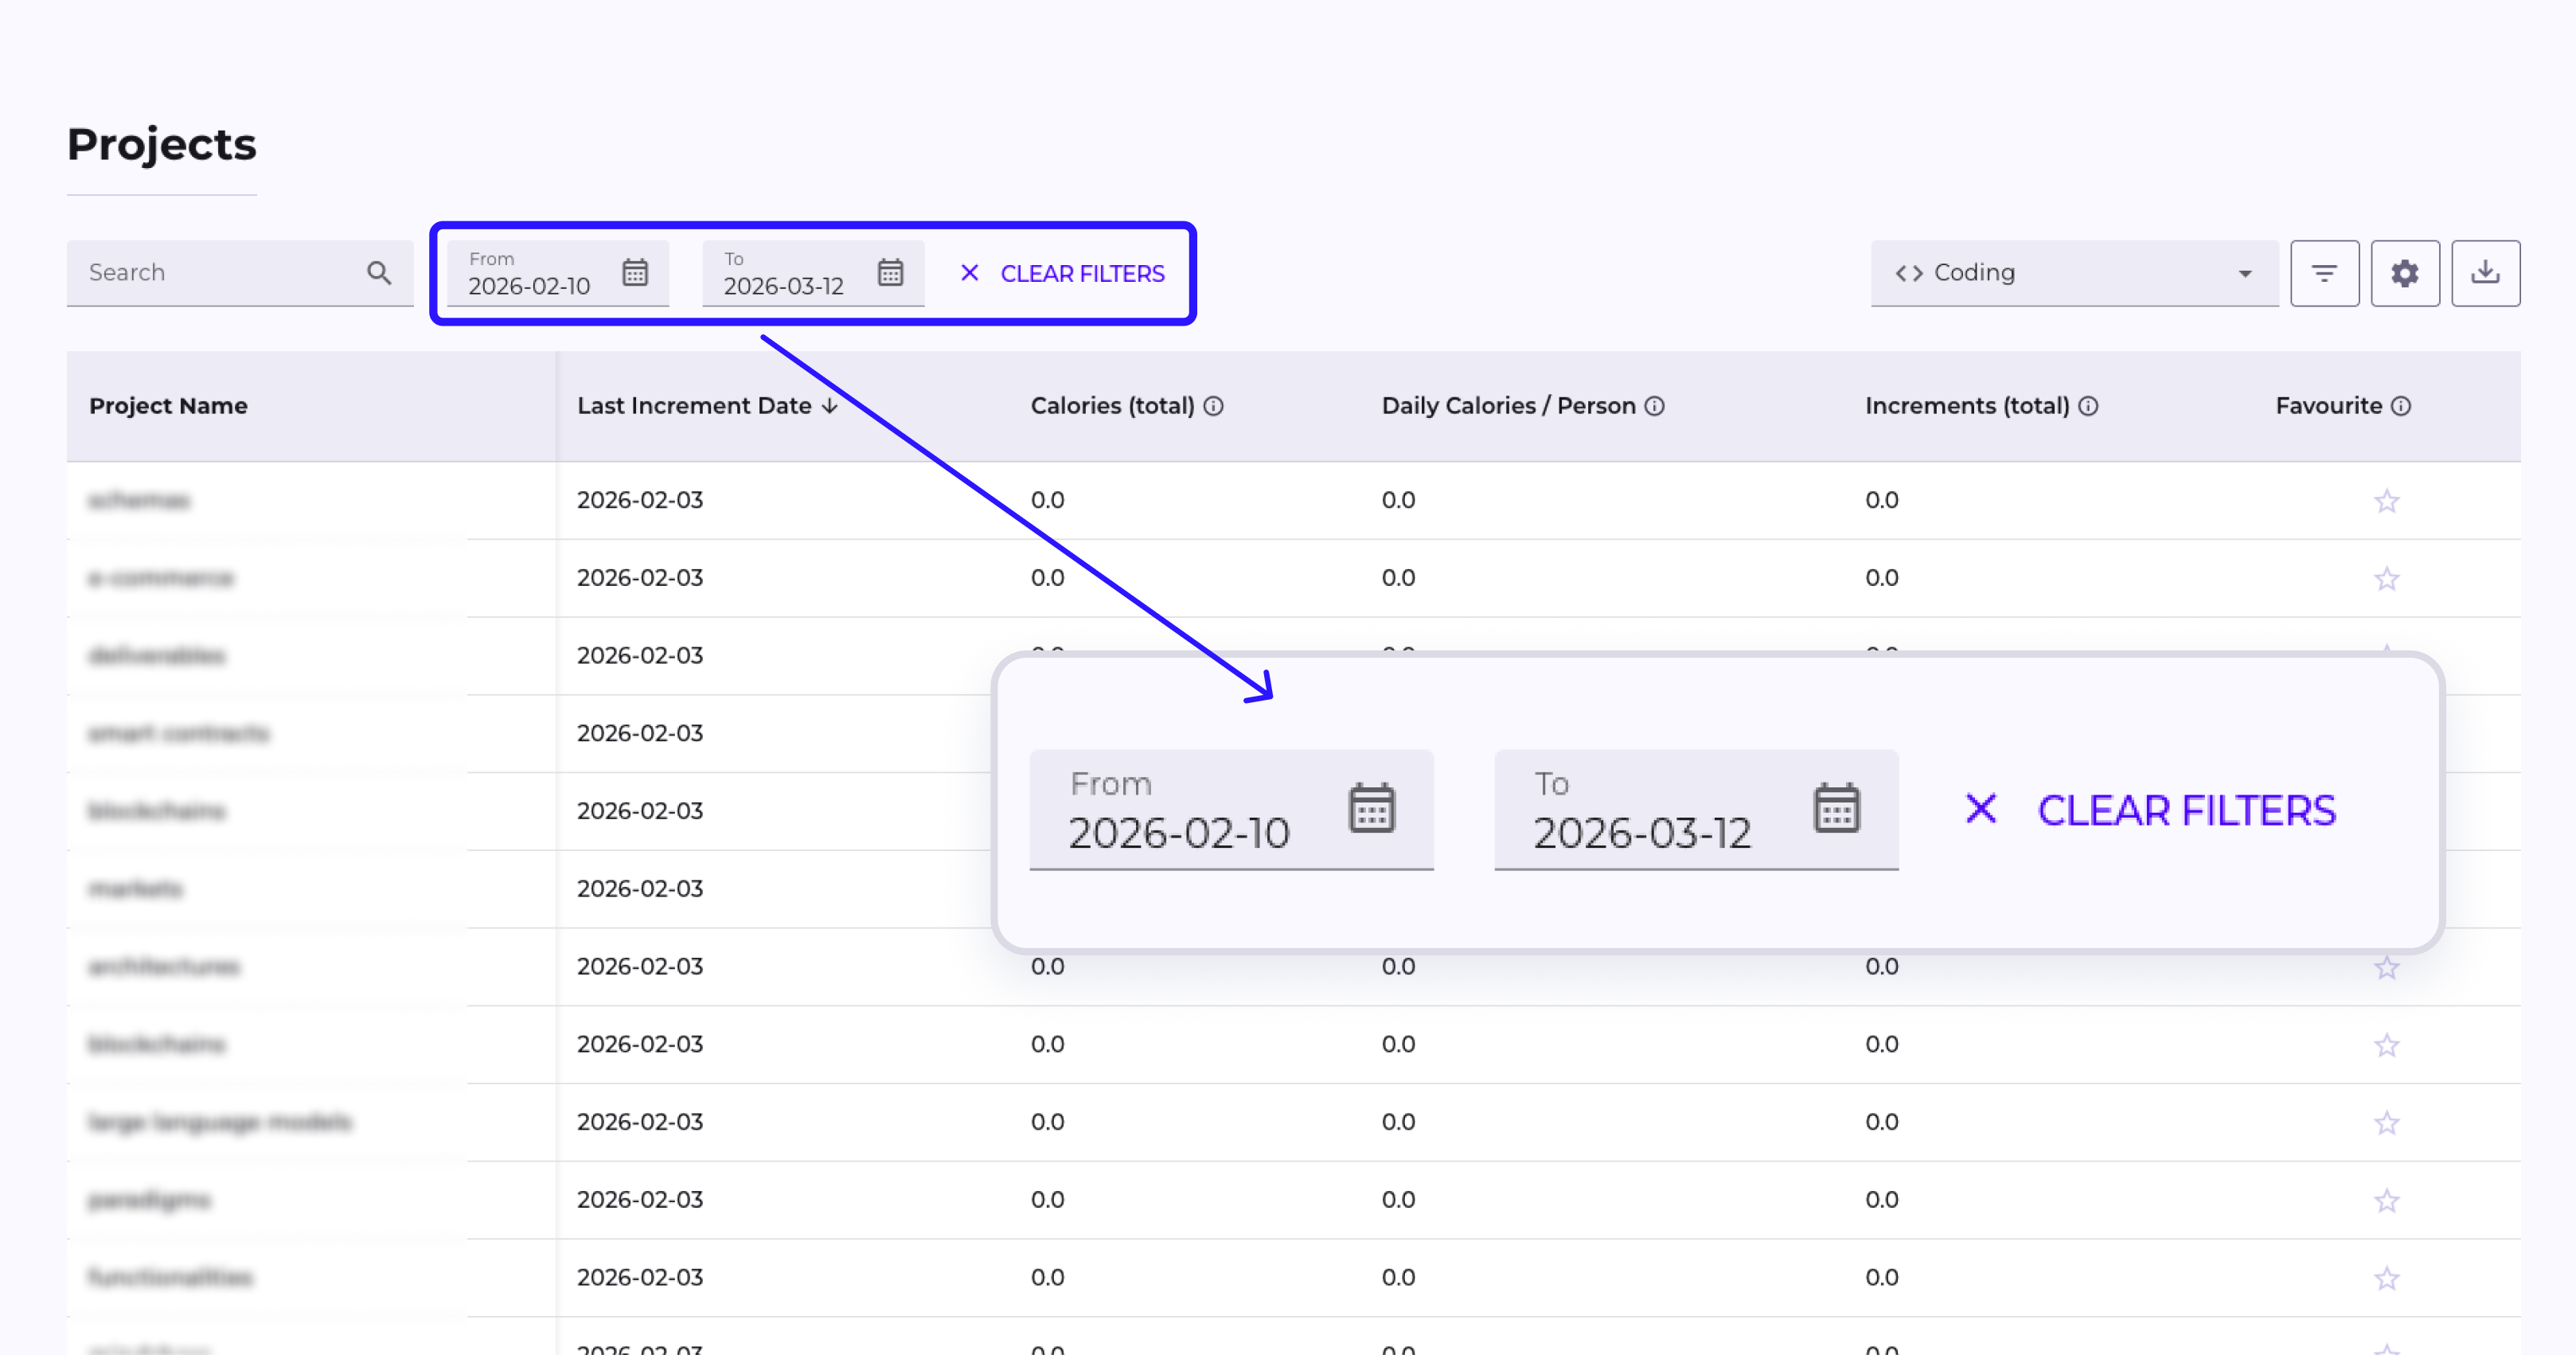
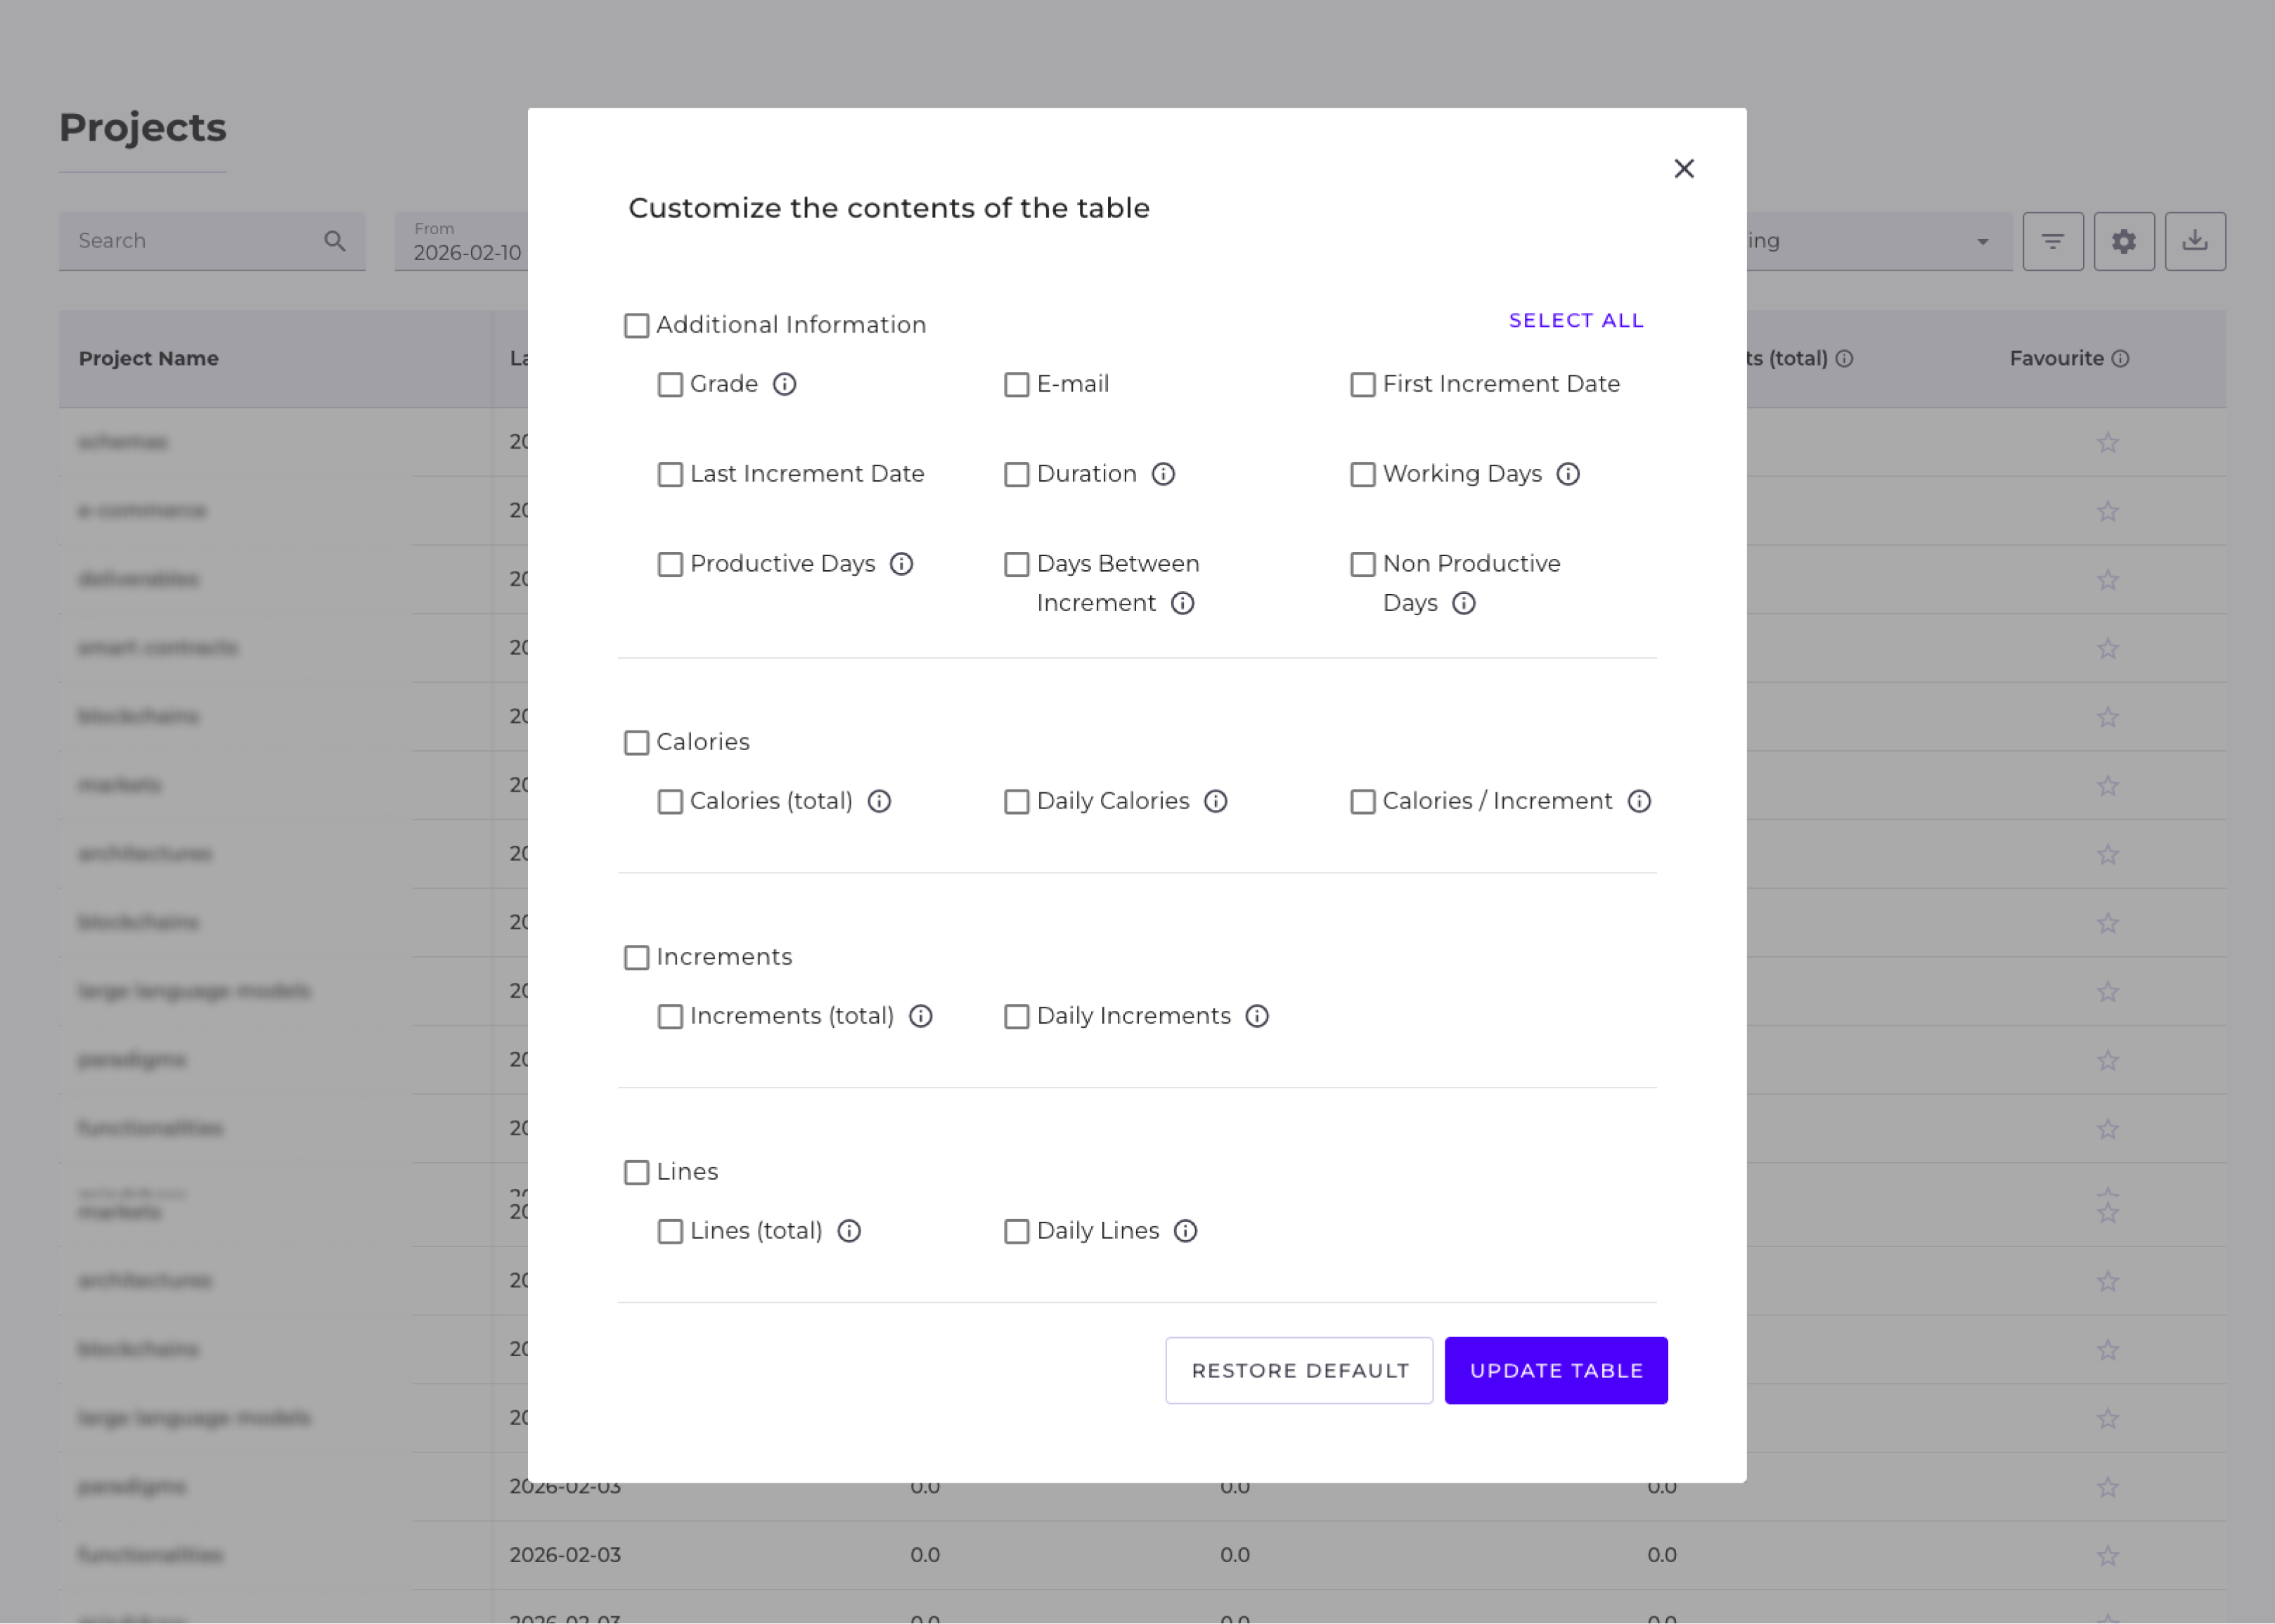
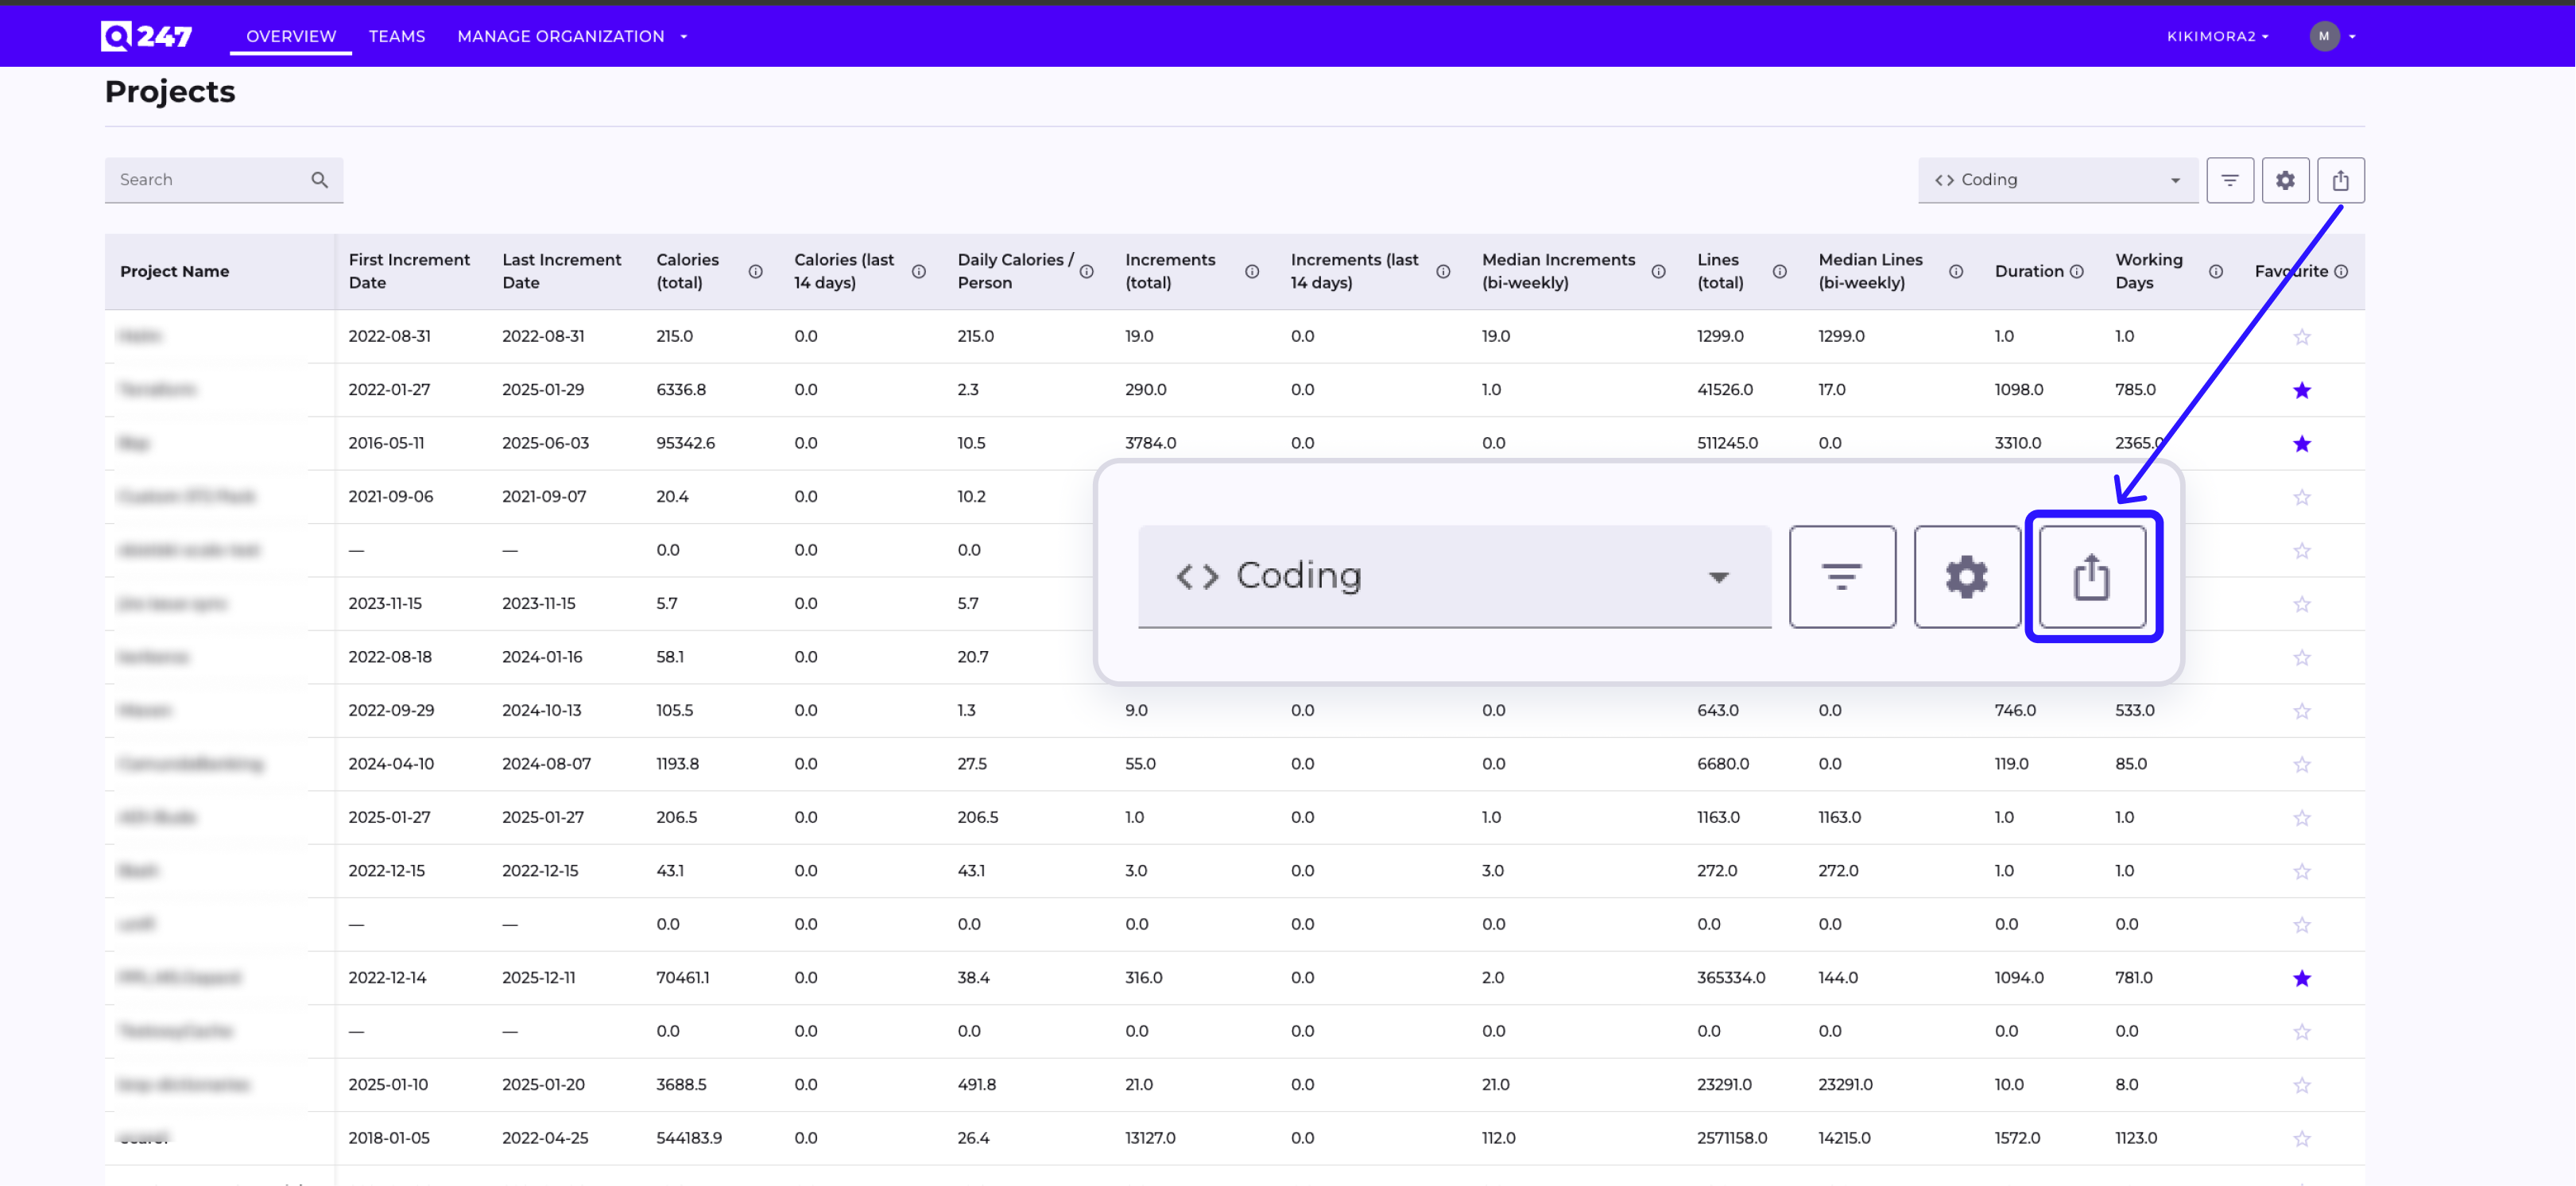
Table and Chart Readability in Analytics Views
Minor improvements to tables and charts: a more readable column layout, filter icons that fit within the layout, improved tooltips and sorting, more precise file names on CSV export, and the elimination of brief chart flickers before the skeleton loader is displayed. The favorites widgets on the home page and favorite teams also work more reliably.
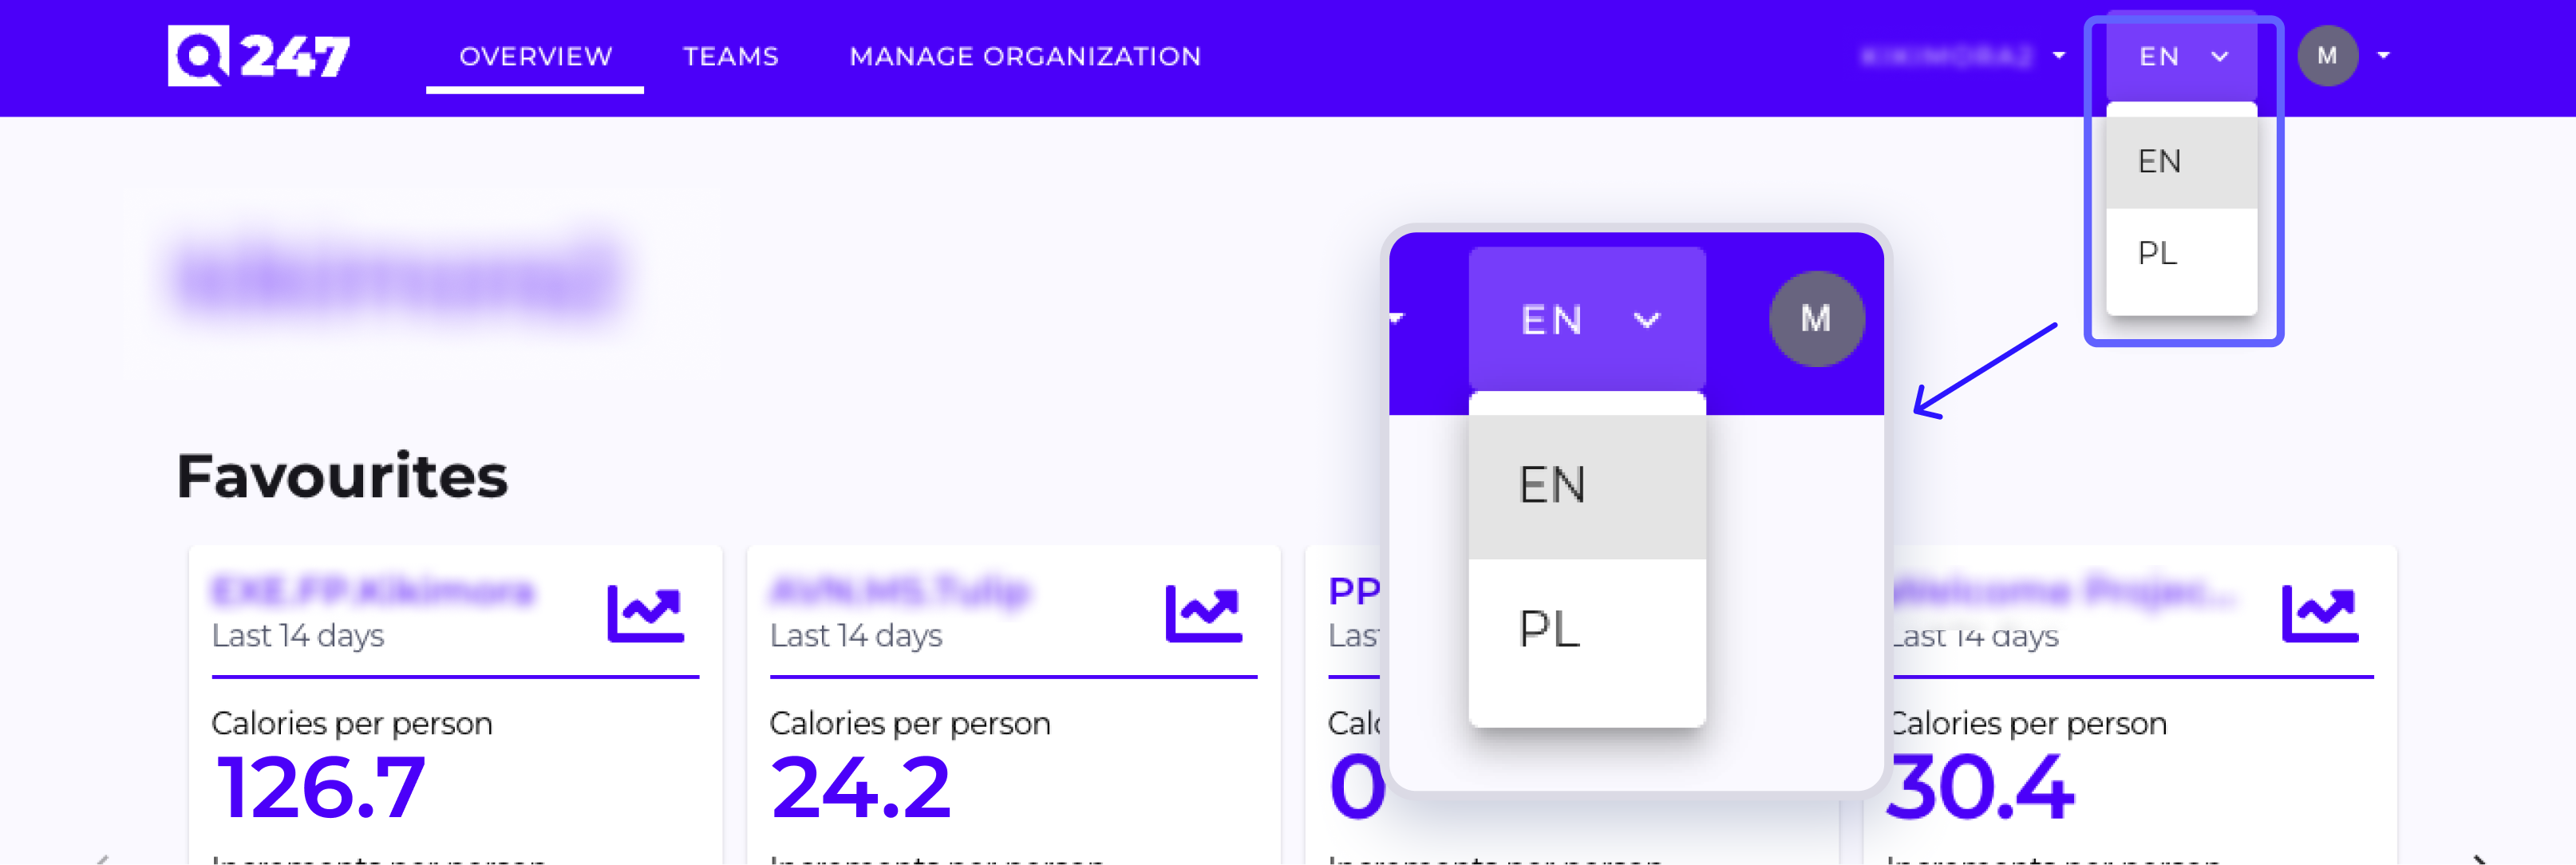
Polish Interface Version
Completed and unified Polish-language interface translations, along with consistent punctuation in notification messages.
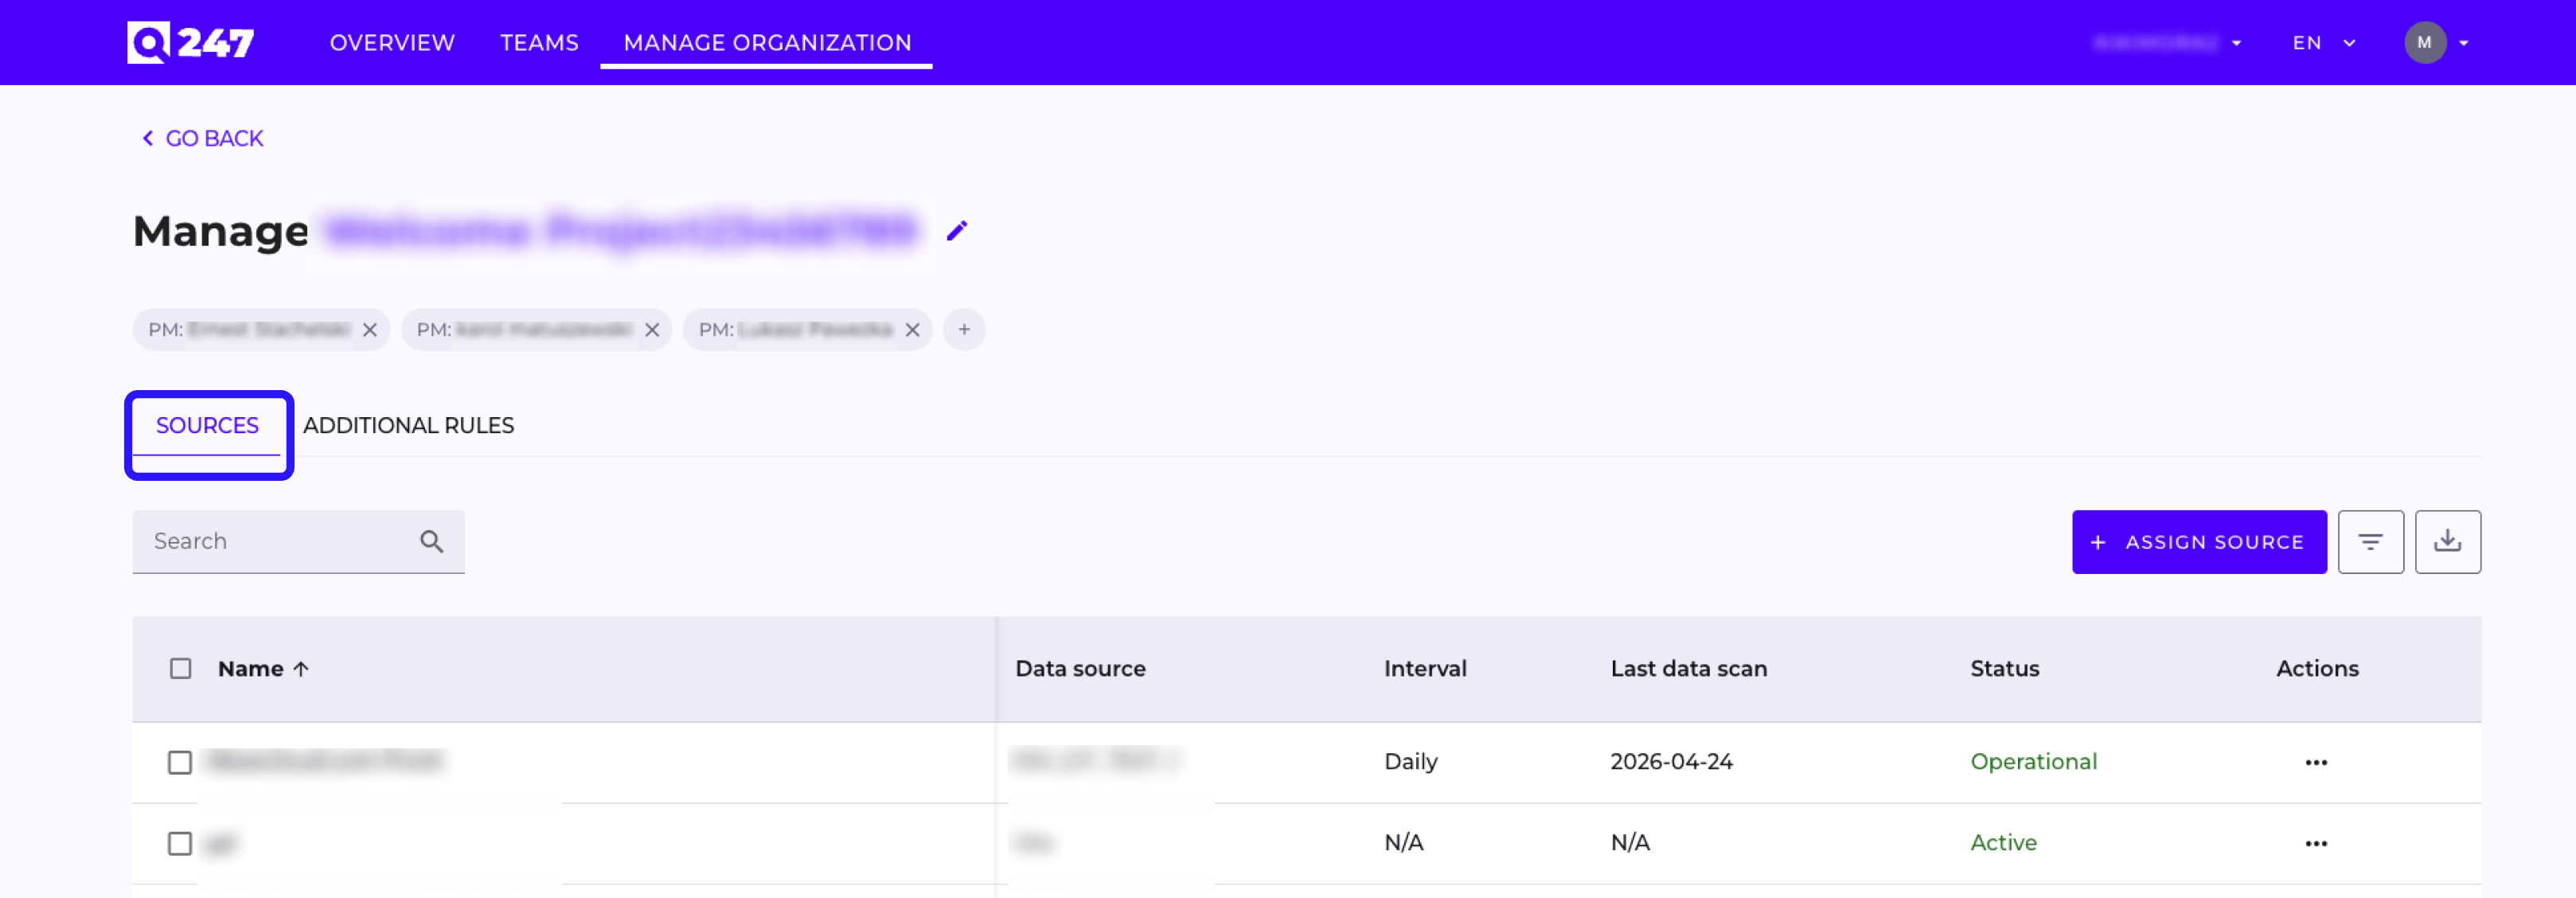
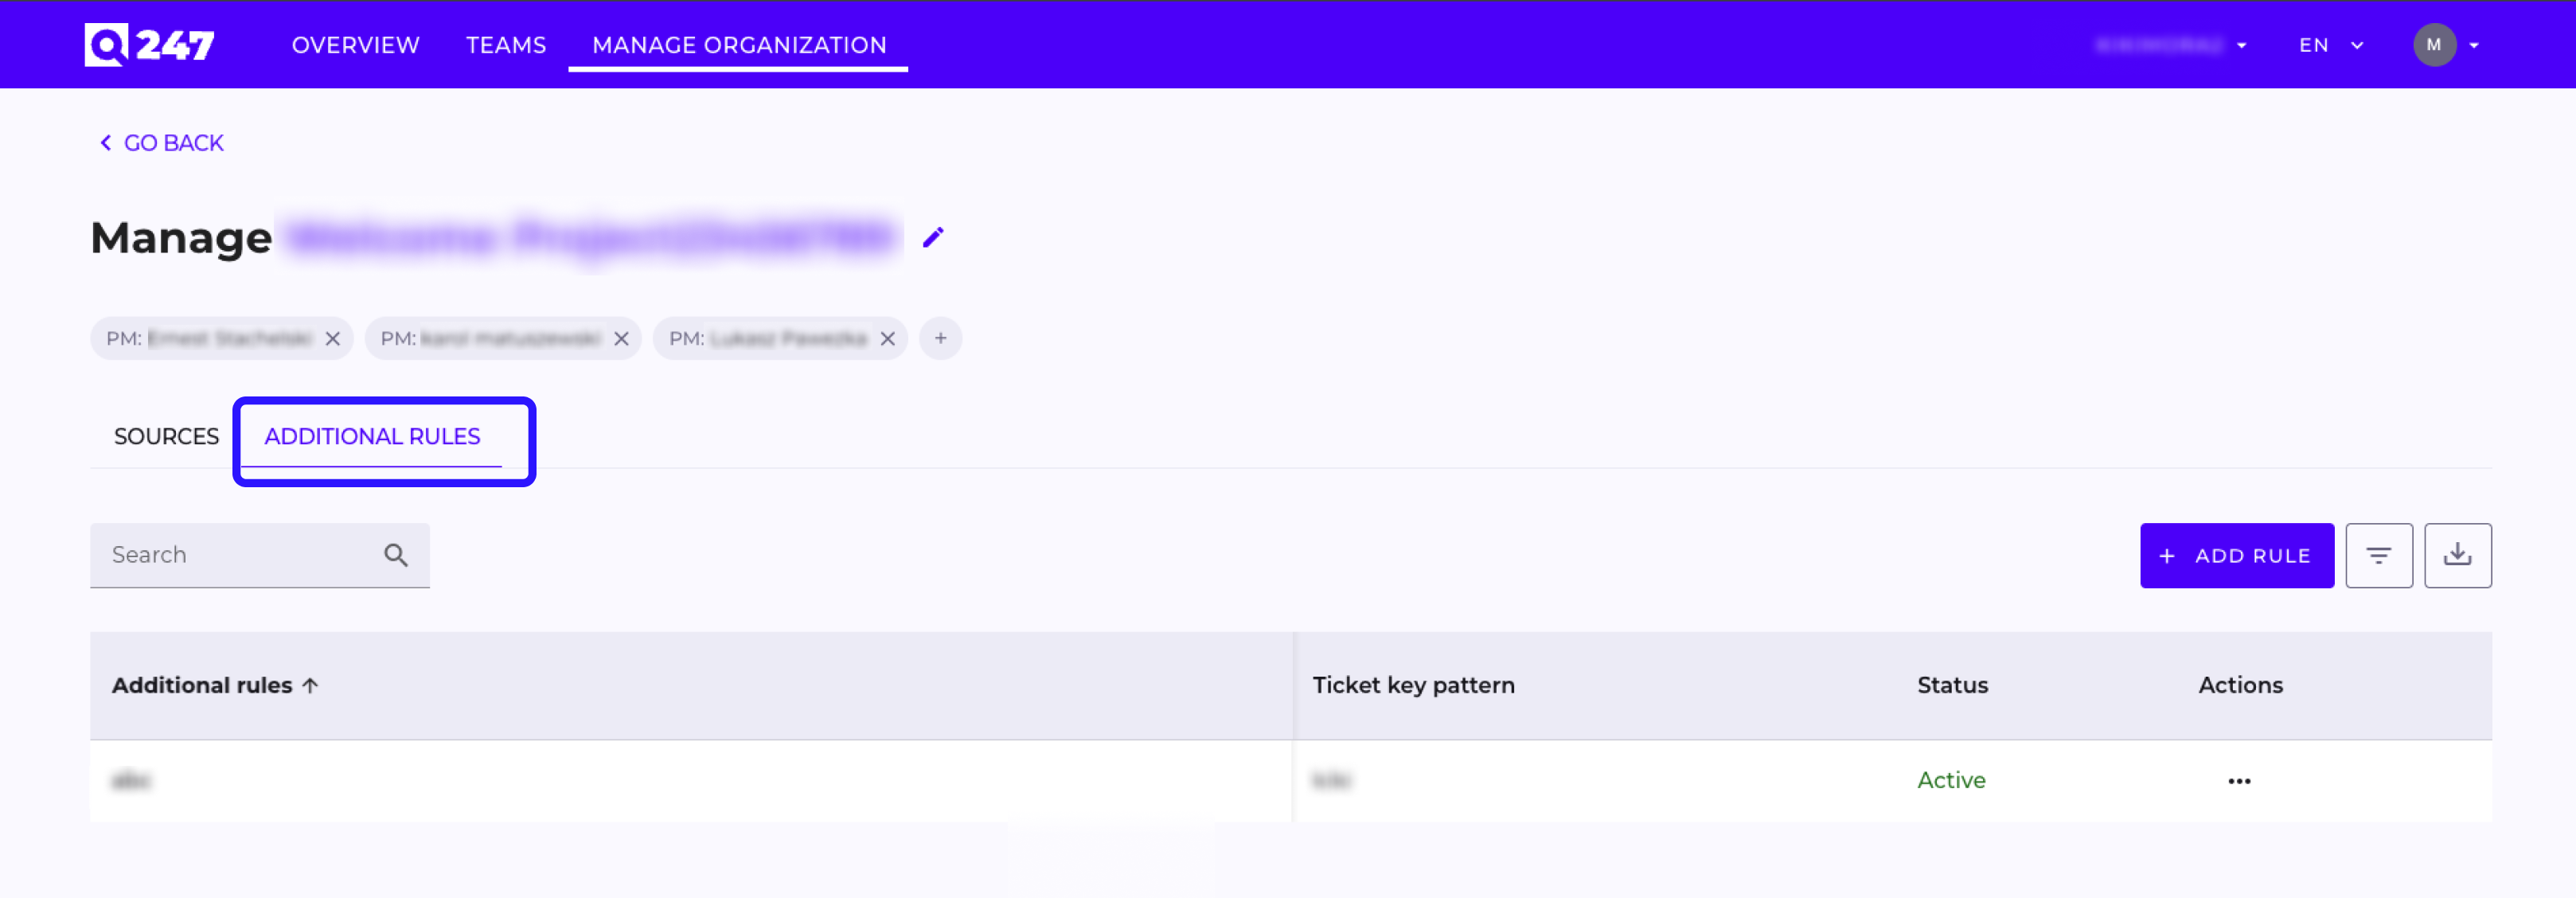
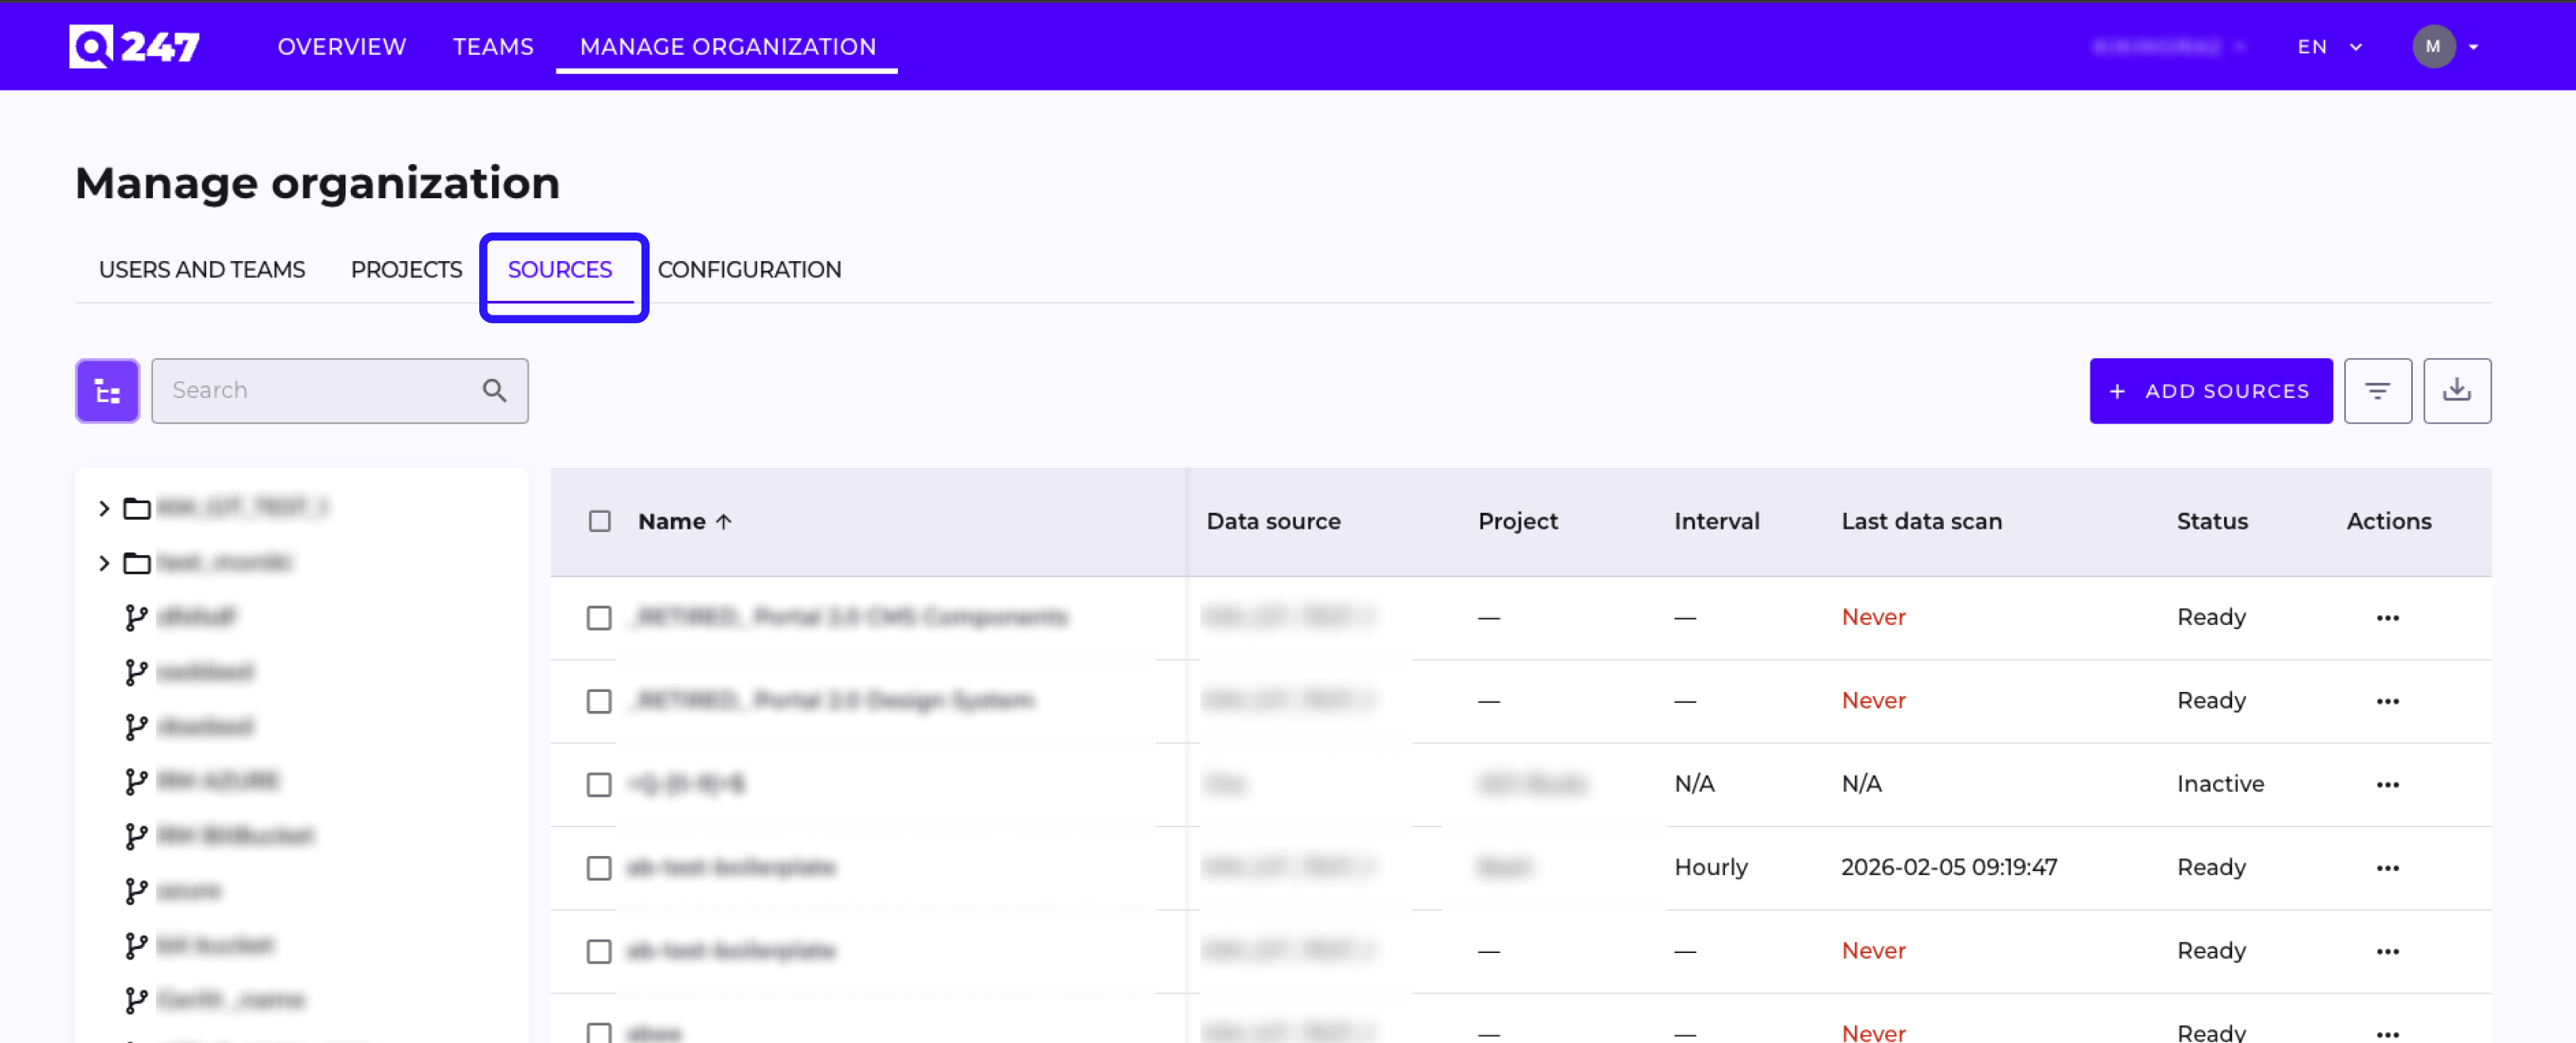
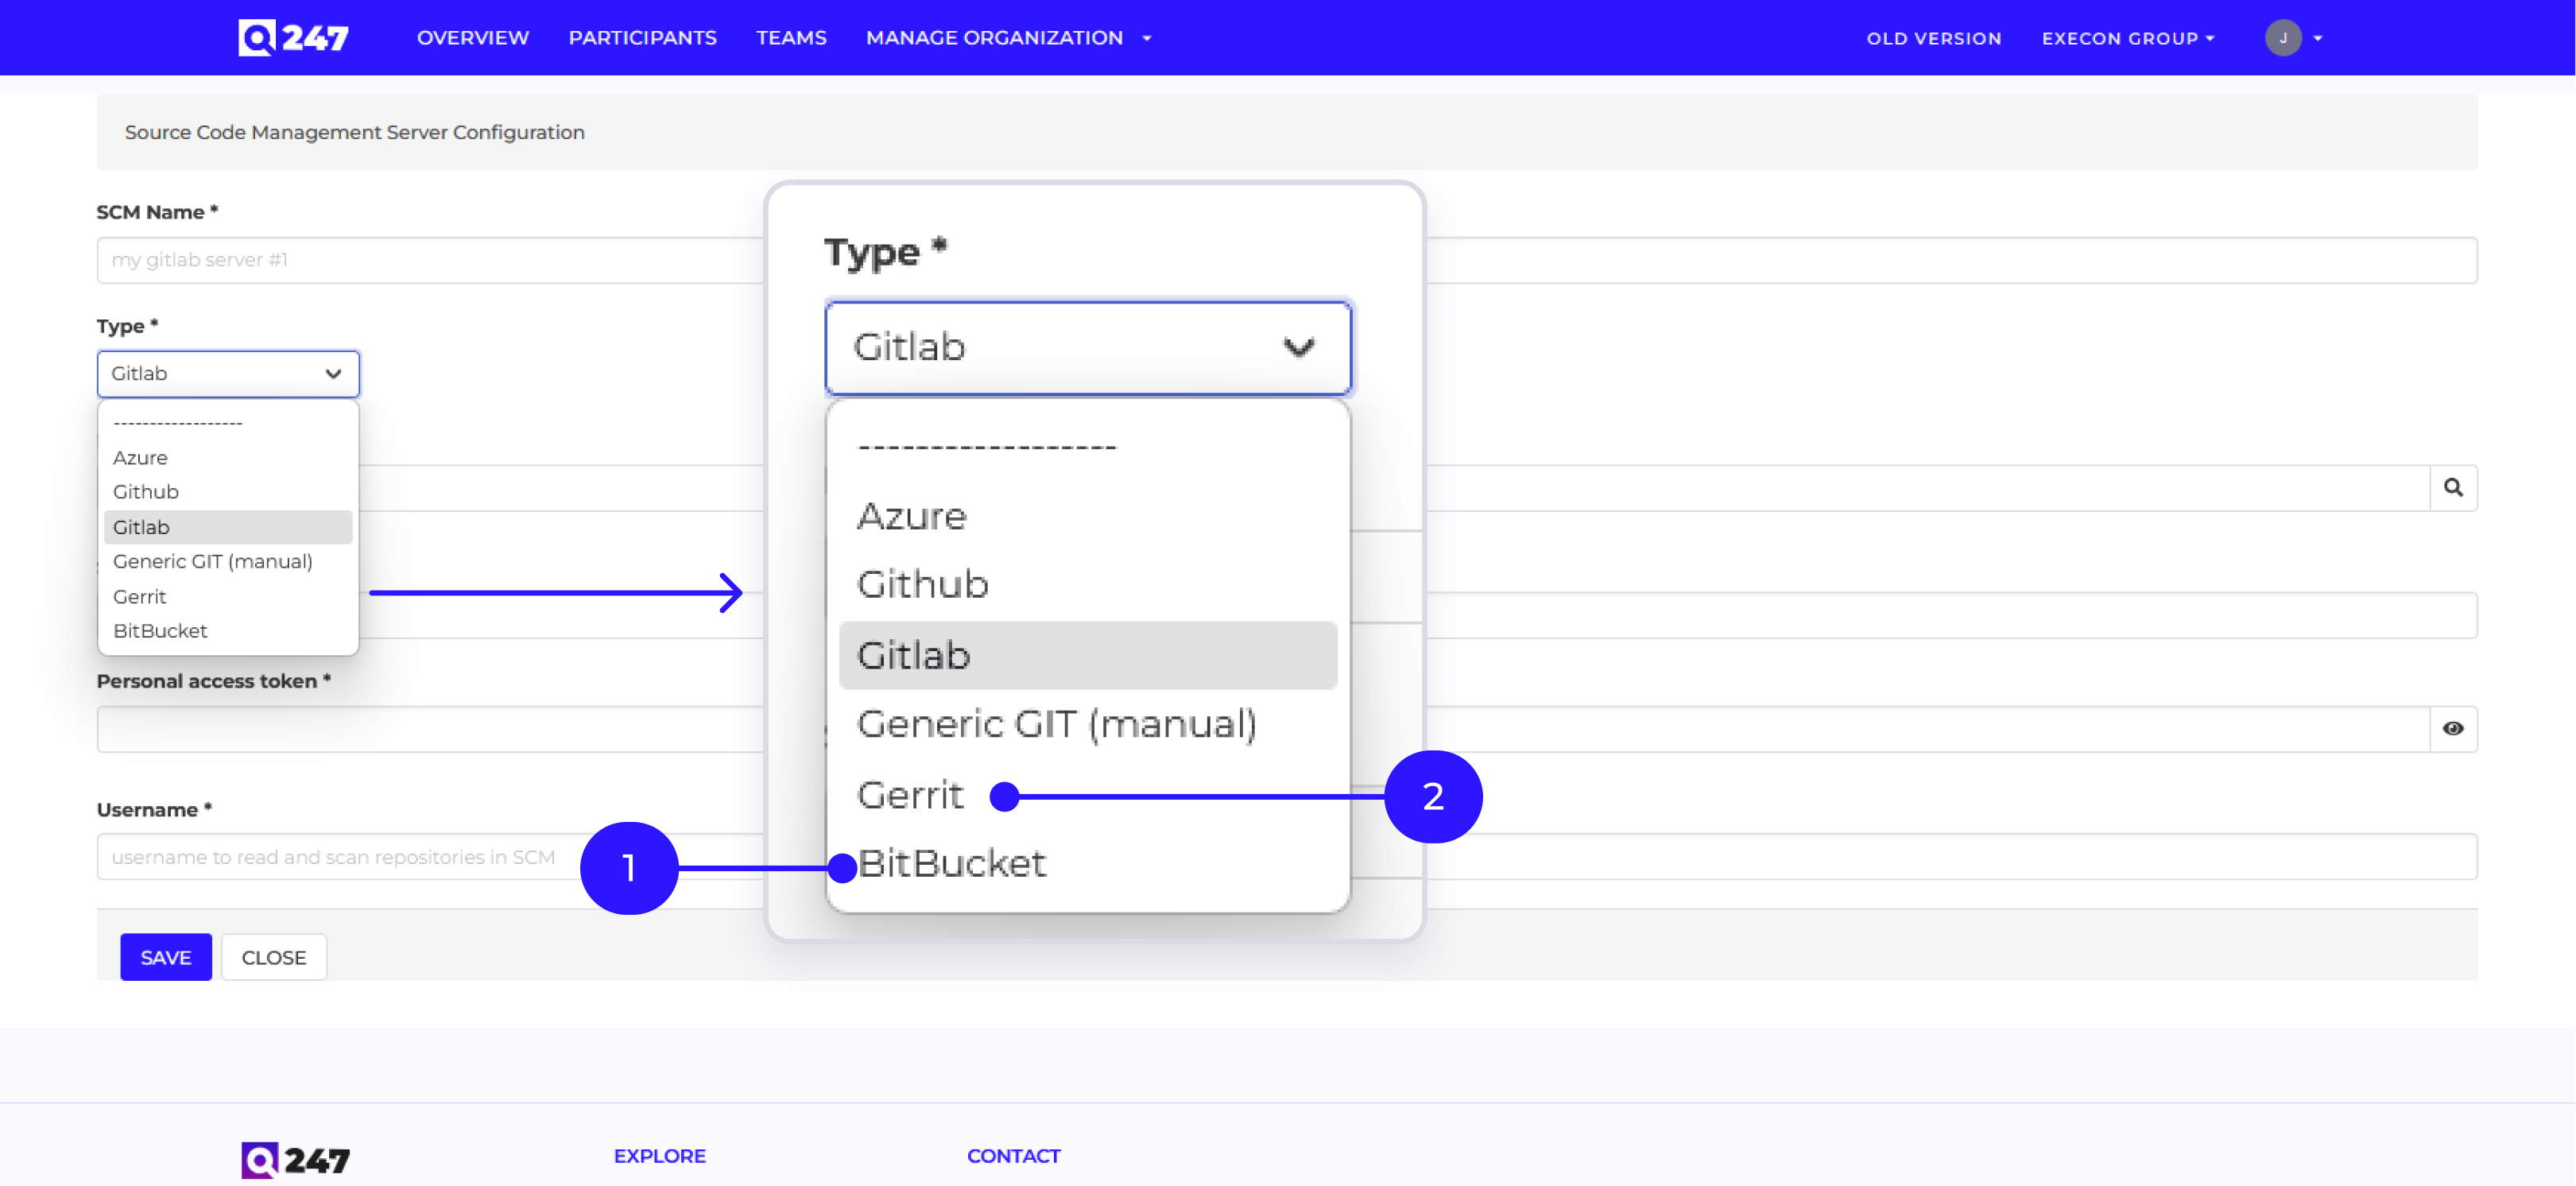
Data Source and Connector Configuration
Form validation in Sources (including the GIT_MANUAL repository URL and source addresses), duplicates eliminated from the source list, a more readable multibar for bulk operations, and consistent default connector settings for new organizations. Minor layout corrections (Client Secret, the "Not working" badge, the Increment Visibility placeholder).
Login and Account Screens
Improved validation messages during login and account activation, a more readable layout for the MFA and new-password screens, and a properly positioned GO BACK button.
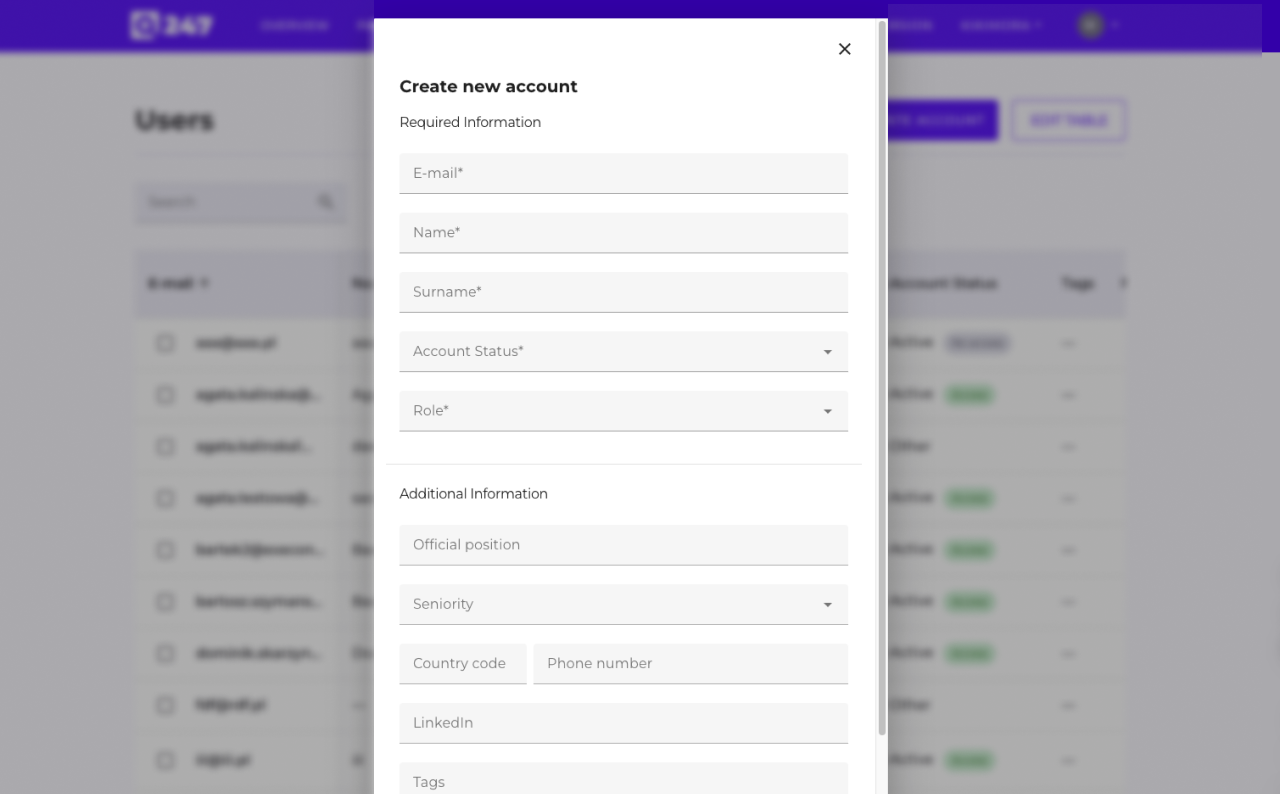
Manage Organization
In Edit Member, the account status can now be saved after a change, and an attempt to change a project name to an empty value is blocked with a message. The CSV export from the user list clearly distinguishes between Active and Aliased statuses.
Faster Participant View Loading
The Participant view loads significantly faster in large organizations. The change covers both the participant card itself and the table of all projects.