(BETA) Version v2.2.4

In update 2.2.4, we focus on improving data visibility, increasing work intuitiveness, and introducing new tools that facilitate project, team, and user management. We have introduced improvements in statistics presentation, navigation, chart and table personalization, as well as enabled administrators to independently create employee accounts within the organization. Below you will find a detailed description of all changes.
Ability to Create New User Accounts by Administrator
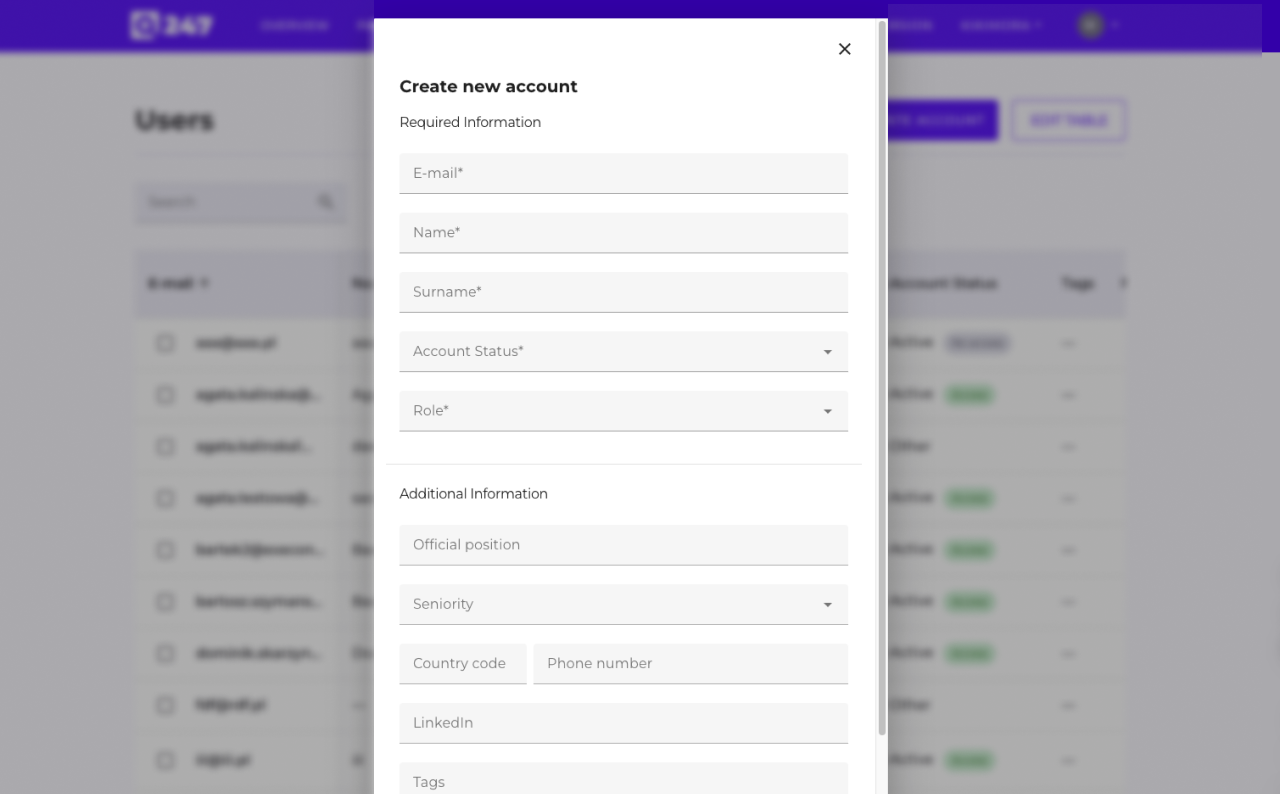
In the Users view, we added the "Create new user" function, which allows administrators to create accounts for users.
The form includes all key data (email, first name, last name, status, roles, position, seniority, phone, tags).
The system sends an activation email and validates data.
How to Add a New Account?
To add a new account in the administrator panel, follow these steps:
- Go to the application page and navigate to the Manage Organization section (available in the header).
- Select the Users tab.
- After opening the user list, click Create an account.
Managing User Permissions in the Organization

We introduced the ability to grant and modify user roles directly in the organization panel. It is now possible to manage Owner, Admin, and Member roles.
Setting User Password
An Administrator or Owner can now activate user access and enforce password setup through automatic sending of the "Activate your account" message. The user receives a unique link valid for 48 hours and sets the first password independently.
Hiding Increments from Jira
We added the ability to hide selected increments from Jira. Users can restore hidden items at any time, which allows for increased analysis accuracy and better control of data visibility. The feature facilitates browsing change history by eliminating irrelevant or erroneous information noise.
Simplified Column Selection in Tables
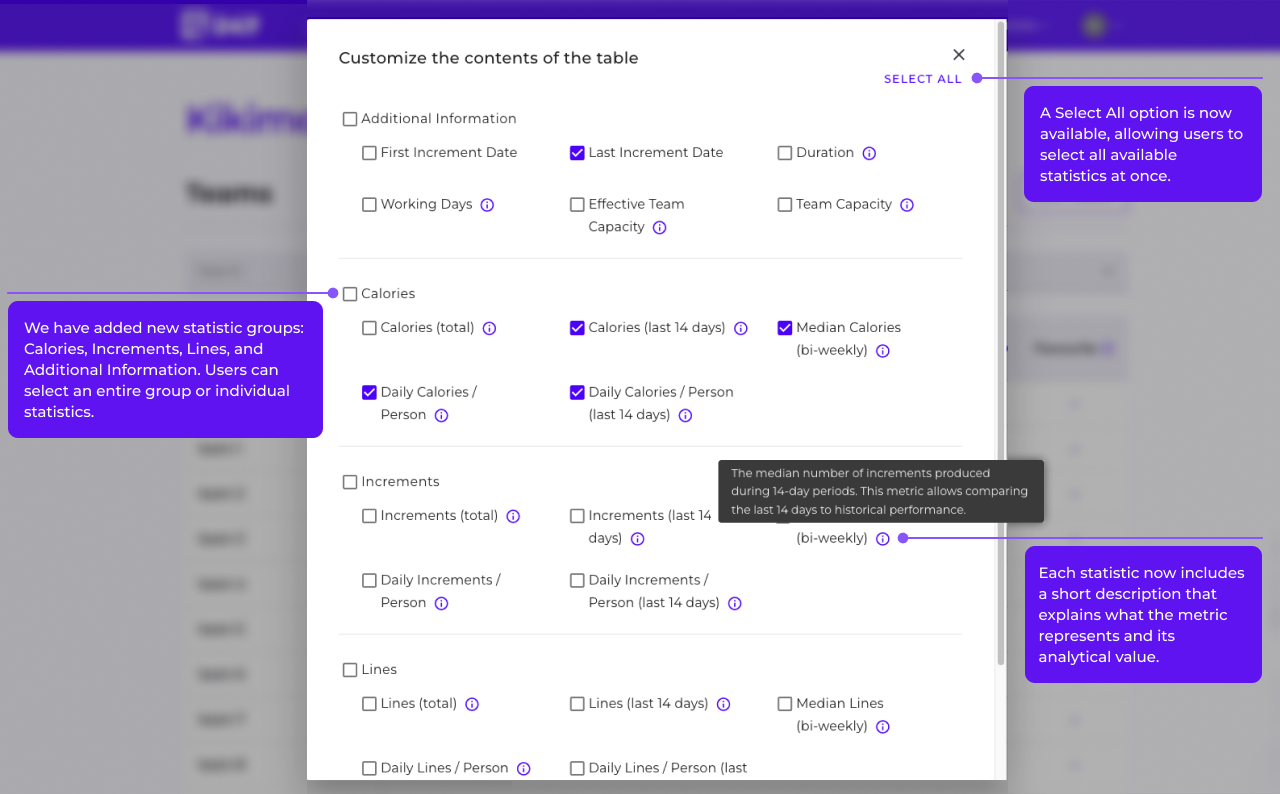
We have grouped the statistics (Calories, Lines, Increments, Additional Information) in the table management section.
Thanks to this, users can find needed data faster and more efficiently adjust the table layout to current analysis. Both selecting all statistics at once and group or individual selection are available, depending on needs.
Added Chart in Teams View
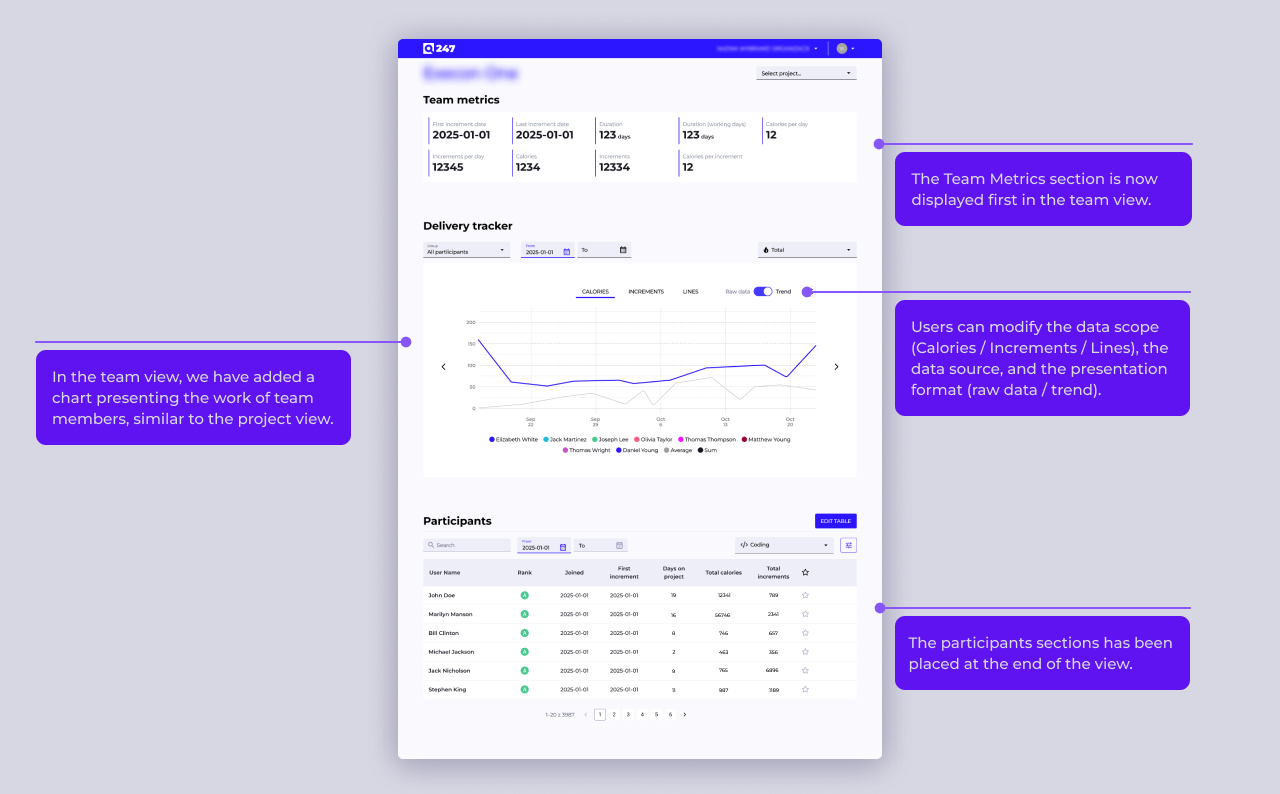
In the team view, we added a chart presenting the work of team members, similar to the project view.
The data range (Calories /Increments /Lines), data source, and presentation form (raw data /trend) are variable. This facilitates team work analysis and activity comparison over time.
Improved Section Order in Participant View
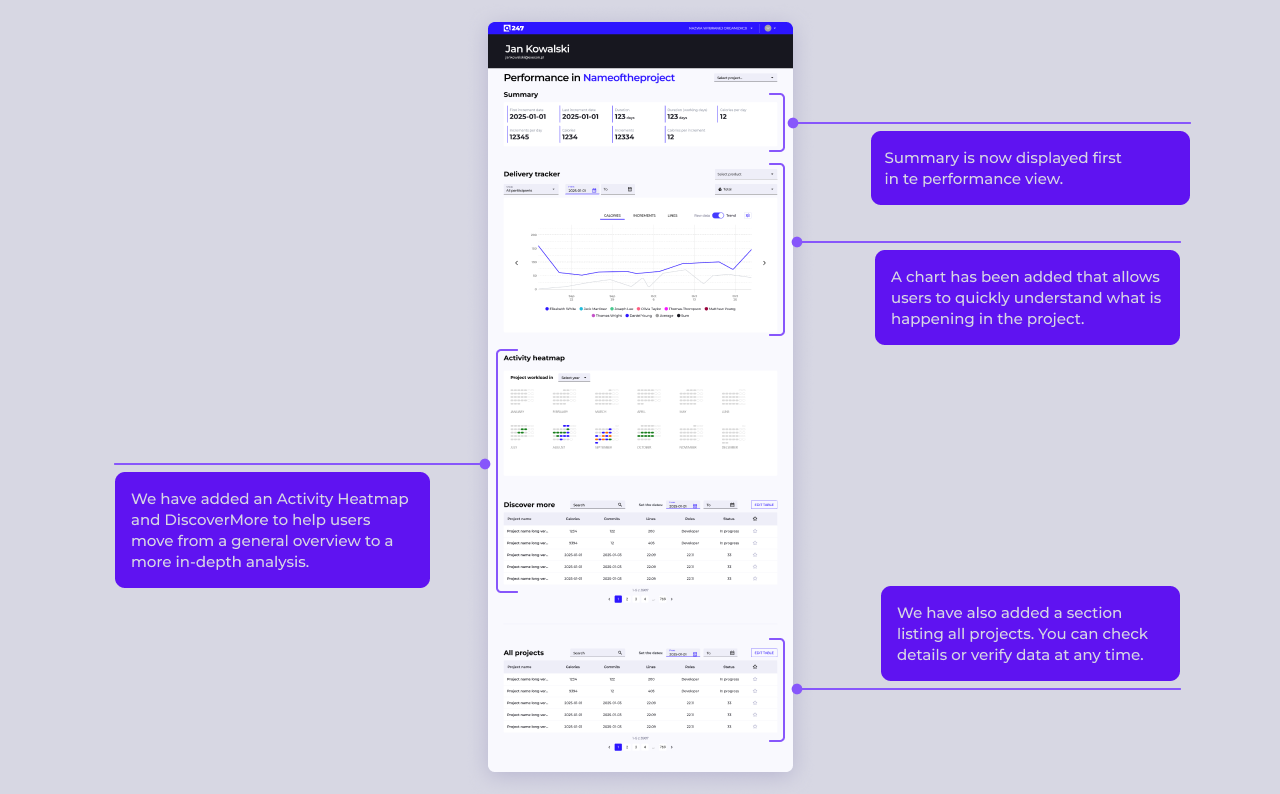
The participant view has been changed to present data from most general to most detailed.
We added section headers and clearly separated data from the selected project from work on other projects. This facilitates orientation on the page and allows faster analysis of key data.
Remembering Settings

All charts present data in raw data mode by default instead of trend.
The system remembers user selection for each view separately. Thanks to this, data analysis is consistent with user preferences.
Remembering Table Settings
Tables remember visible columns, active sorting, and view layout for each user and view separately.
After refreshing the page or returning to the view, the system restores user preferences. This streamlines analytical work and eliminates the need for reconfiguration.
Tooltips in Tables
We introduced tooltips explaining the meaning of data in tables, which appear only when the name is truncated. Thanks to this, users understand presented statistics faster, and the interface is more readable and clear. The solution facilitates data analysis and onboarding of new users.