Dashboards
Five views in which the data collected by Q247 can be read. They differ in the level they aggregate data to, from the whole organization down to a single person.
The metrics are the same in each of them. What changes is the scope of aggregation and which elements make sense at a given level; Flow Metrics, for example, exist only at project level.
View levels
| View | Description |
|---|---|
| Overview | The whole organization, with a list of projects. The first screen after signing in, for a general check of the situation. |
| Project | One project together with its participants. The day to day work of a project manager. |
| Teams | A list of all teams in the organization, for comparing them with each other. |
| Team | One team and its members. The work of a team manager. |
| Participant | One person across all of their projects. Development conversations, verification of a single result. |
Project and team as two cross sections of the same data
A project is a set of data sources assigned to it: code repositories and documentation sources. It groups work by what the work was done on.
A team is a set of people. It groups the same work by who did it.
Both are calculated from the same set of events, only summed differently. The same commit therefore counts towards the result of the project its repository belongs to, towards the result of the team its author belongs to, and towards the result of that author. This is why values from Project and from Team do not add up to any common total: they are two cross sections, not two separate parts.
Recurring elements
These elements work the same way in every view where they appear.
-
The date range selector sets the period the values on the page are calculated for. The options are Last 14 days, Previous 14 days, Last 30 days, Previous 30 days, Last 90 days, Previous 90 days and Custom, which lets you pick your own dates. Previous 14, 30 and 90 days is a period of the same length directly before Last 14, 30 or 90 days, with no days in common with them. For example, on 24 September Last 14 days covers 10 to 23 September, and Previous 14 days covers 27 August to 9 September. Exactly one option is always highlighted.
On a computer, the dates of each ready-made range are shown under its name. On a phone, the ready-made ranges are buttons with the name only, and their dates are shown by the selection in the calendar. The selector button in the top bar shows the name of the selected range, and for a custom range its dates in the DD.MM.YYYY format.
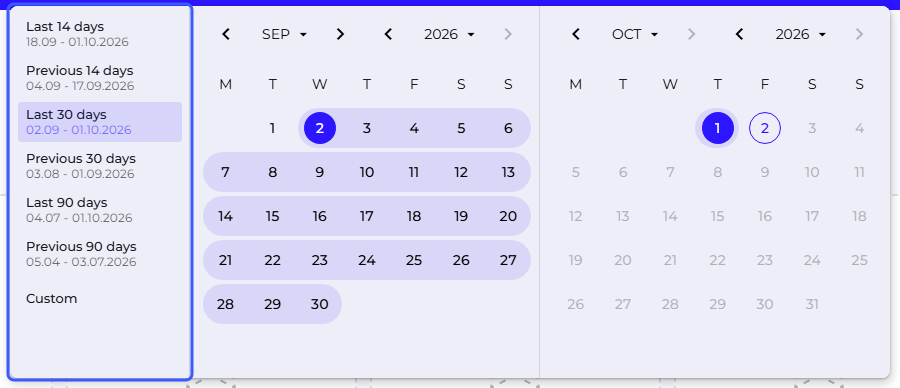
A ready-made range takes effect immediately after you click it and closes the panel. Selecting Custom or clicking a day in the calendar switches the panel to Custom mode, in which the number of days in the range and the Cancel and Apply buttons appear at the bottom. A range picked in this mode takes effect only after you click Apply. Cancel, the Escape key, and clicking outside the panel discard the selection and leave the previous range in place.
The Apply button stays disabled until the range has both dates. It is also disabled when the picked range is identical to the custom range currently in effect, and when the From or To field holds an incomplete, invalid or empty value. To pick a single-day range, click the same day twice.
On a computer, you can also type the dates of a custom range in the From and To fields, in the YYYY-MM-DD format. A valid date moves the calendar right away. An incomplete or invalid date does not change the range and is highlighted in red when you leave the field. An end date earlier than the start date narrows the range to a single day. On a phone there are no fields to type in, and you pick the dates in the calendar.
Ready-made ranges end yesterday, and in a custom range you can also pick today. Future dates are blocked. Dates clicked in the calendar in reverse order are reordered automatically by the selector, and the calendar header lets you jump straight to a chosen month and year.
The range applies across all views at once and is remembered when moving between them and after refreshing the page. On first entry, Last 30 days is set. The choice is saved in the browser profile, regardless of the logged-in account, so people logging in within the same browser profile share one range. A ready-made range is counted from the current date on the next visit, while a custom range keeps the dates you picked. Manage Organization has no date range selector of its own.
-
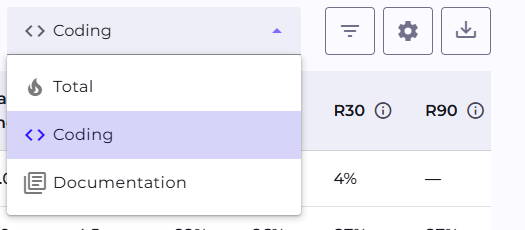
Calories Type switches which activity the metrics are calculated from. It is one shared choice for the whole page, stored locally in the browser. How long that choice is remembered differs between views, which Calories Type describes. There are three options:
- Total: commits plus events from documentation systems together.
- Coding: only commits in a repository.
- Documentation: only Jira tickets, Confluence pages, Azure Boards work items and Azure Wiki pages.
-
The "Team metrics" card strip on the Project and Team pages summarizes that unit within the selected date range.
-
A table appears in every view, but its subject changes: projects on the Overview, teams in Teams, participants in Project and Team, and all of a person's projects in Participant. Each of them lets you move from the aggregate level down a level.
-
The gear icon in the tables opens the "Customize table content" window, where metric columns grouped into categories are turned on and off. The column choice is separate for each table.
-
The star next to a row or in the header of a details page pins an item to the Favourites carousel on the Overview.
Cards in the Favourites carousel on the Overview show numbers for the last 14 days, regardless of the range selected for the rest of the page.
Cards in the "Team metrics" section do not react to Calories Type. Their values stay the same for every option of that selector, unlike the charts and tables on the same page.
Aggregate values are worth reading together with the table below them. The same team result can come from an even contribution by several people or from the work of one, and only the level below settles that.
Access to the views
Which projects and teams a person sees follows from their access to a specific project and from their team role, both described in Permissions. The Admin role on its own does not open business data.
Subpages
Overview
The first page after signing in, an aggregate view of all projects and the list of favourites.
Project
Details of a single project, from team metrics to the list of participants.
Participant
Details of one person, opened from the participants table of a project or team.
Teams
The list of all teams in the organization, available from the main navigation.
Team
Details of one team, aggregated data for all of its members.
See also
- Metrics: what the individual numbers mean and how they are calculated
- AI features: the AI Assistant and AI Adoption, both visible inside the dashboards
- Permissions: who sees which projects and teams