Participant
This page shows the details of one participant. It opens after clicking a row in the participants table on Project or Team. The Q247 interface has no generic name of its own for this view; it only shows the first and last name or e-mail of the specific person. "Participant" is a descriptive name used in this documentation, not a literal string from the application.
Visibility of some elements depends on the organization's configuration and the purchased package. This description assumes all of them are enabled.Participant header

A dark bar at the very top shows the participant's first and last name, their e-mail and a star. The star works as a toggle: it adds or removes the participant from the Favourites carousel on the Overview.
Summary

The "Select project" dropdown (with the "Total Performance" option always at the top of the list) decides what all the sections of this page show:
- Total Performance: data from all of the projects in which the participant is active, weighted by the number of days.
- A specific project: data from that one project only. The title above the cards changes to "Performance in [project name]".
This choice covers the Summary cards, the Delivery tracker chart, the Activity map, the OTIF - Retention widget and the Discover more table. The All projects table at the bottom of the page is an exception: it always shows all of the participant's projects, regardless of what is selected in this dropdown.
Summary cards:
-
Last increment date: the date of the participant's last recorded activity, and below it the date of the first activity. Both from the entire history, regardless of the selected date range. → Activity period
-
Duration: the number of calendar days with the participant's activity in the selected date range.
-
Calories (total): the sum of the participant's development effort (Calories) in this period.
-
Calories per increment: the average number of Calories per increment.
-
Increments (total): the total number of recorded changes (commits, tickets, etc.) by the participant.
-
Work in progress: the number of the participant's tickets in progress at the end of the selected period. Visible only when the project has a Jira integration. → Flow Metrics
None of these cards depend on the Calories Type selector; their values do not change, regardless of the selected option.
Delivery tracker
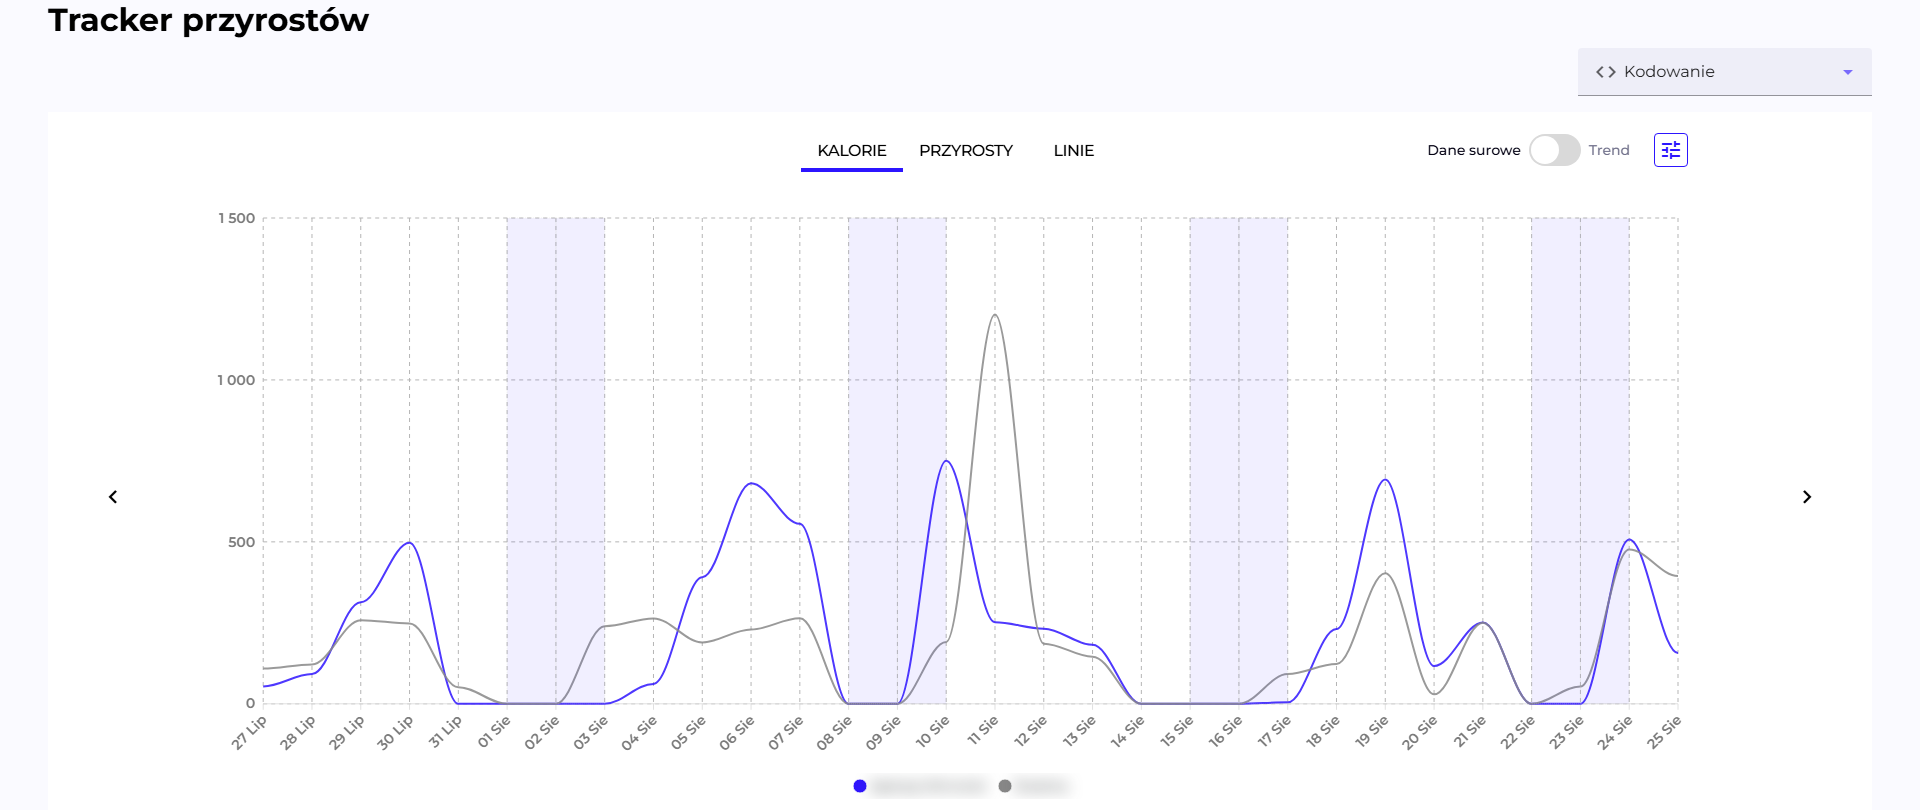
The chart shows the participant's activity day by day. Two lines: blue is the participant, grey is the average of the whole project (or, in the "Total Performance" view, the average across all of their projects). The CALORIES / INCREMENTS / LINES tabs switch which of the metrics from Calories, Increments and Lines the chart represents. The Raw data / Trend toggle replaces daily values with a 14-day moving average, which smooths out fluctuations and makes the trend easier to see. The shaded bands in the background are weekends.
The Calories Type selector (in the screenshot: "Coding") is shared here between this chart and the Activity map: Total / Coding / Documentation, full description on the Calories Type page. This is a separate setting from the one on the Project page (it has its own storage), but it works on the same principle: saved locally in the browser, it applies on every Participant page you visit, regardless of the specific participant or project.
Activity map
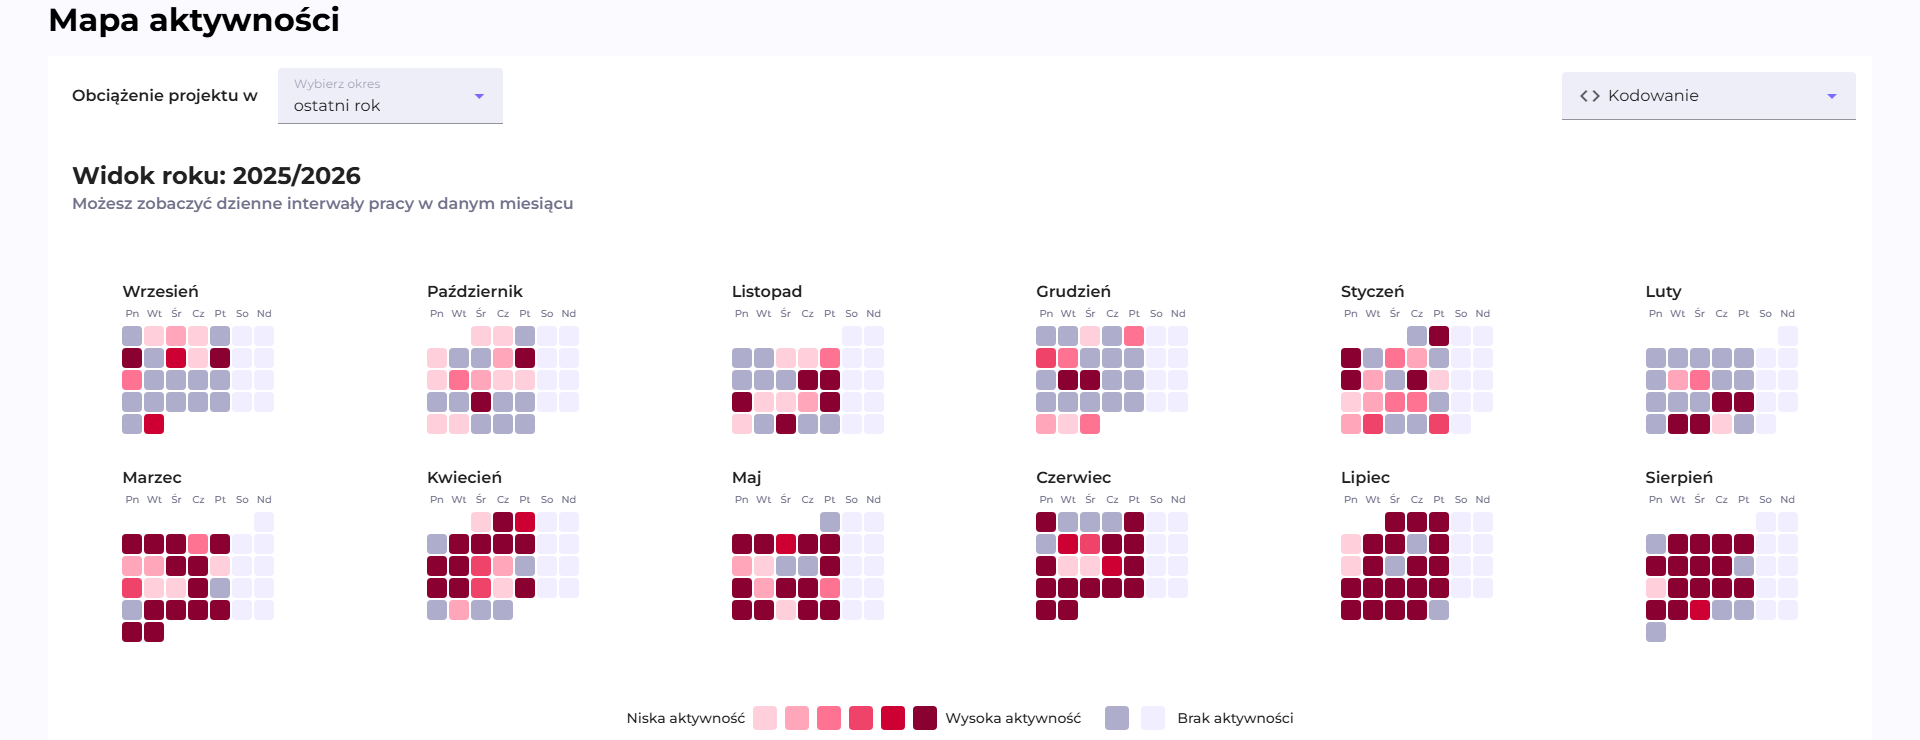
A heatmap showing the participant's activity level day by day, spread over 12 months. The "Select period" dropdown switches the range: Year (default, as in the screenshot), Week or Day. This range is independent of the global date selector in the top bar of the page.
A cell's shade reflects what portion of full load is filled by the participant's Calories in that cell, and a grey square means no activity, with a lighter variant for weekends. The color thresholds, the full load of a cell in each of the three ranges, and the remaining shades of grey are described by Workload.
OTIF - Retention

A widget with four indicators: what percentage of added lines of code survived, meaning it was not overwritten or deleted, after 1, 7, 30 and 90 days. Each indicator is calculated in a window shifted by as many days as its name states. Calculated over the scope selected in the the "Select project" dropdown (one project or all of them together). → Retention
Discover more
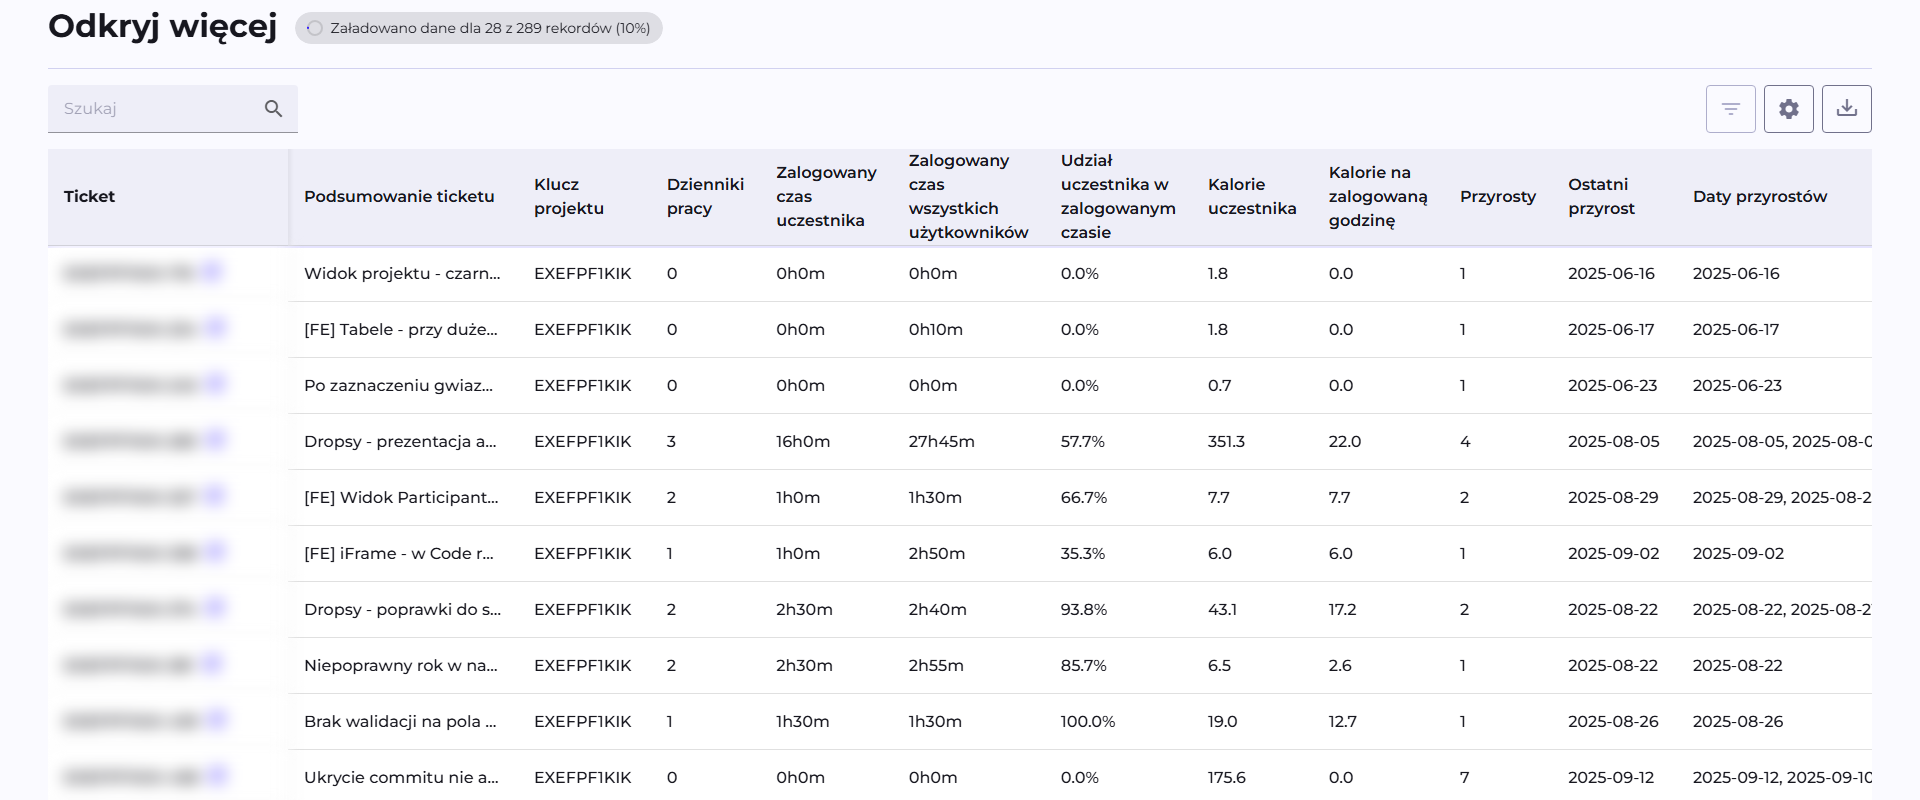
This section is visible only when the organization has a Jira/Tempo integration configured. A table of the tickets the participant worked on, with the time logged in Jira/Tempo. Data loads in batches in the background, a counter next to the title shows the progress ("Loaded data for X of Y records"), and with a large number of tickets, full loading can take up to a few minutes. → Worklogs: full description of the columns and formulas.
The time logged against a ticket comes from Jira/Tempo, while Calories come from the participant's commits. A row matches the two by the ticket key read from the commit message: the Calories column for the participant sums the Calories of the commits whose message contained that ticket's key.
This is why a ticket with logged time but no Calories usually points to commits described without a ticket key, not to work with no effect in the code. The rules for recognizing the key and the recommended message format are described by Additional rules.
All projects

A table of the projects in which the participant is active, with a toolbar:
- Search: searches by project name.
- Calories Type selector: Total / Coding / Documentation.
- The filter icon: opens the "Filter" window with separate conditions for each column.
- The gear icon: opens the "Customize table content" window, turning columns grouped into categories on and off.
- The down-arrow icon: exports the visible columns and rows to CSV.
Default visible columns: Project, Activity, Last Increment Date, R30, Calories (total), Daily Calories, Increments (total), Daily Increments, Favourite. Clicking a row goes to the Project page for that project.
Statistics available in the table
All the metrics that can be turned on in the "Customize table content" window, grouped into 5 categories exactly as in that window. Each value applies to this participant in the given project (one table row).
Additional information
| Column | What it shows | Visible by default |
|---|---|---|
| First Increment Date | The participant's first activity in this project, from the entire history. | No |
| Last Increment Date | The last recorded activity, from the entire history. | Yes |
| Duration | The number of calendar days with activity in the selected date range. | No |
Retention
| Column | What it shows | Visible by default |
|---|---|---|
| R1 | What percentage of added lines of code survived, meaning it was not overwritten or deleted, after 1 day. Each indicator is calculated in a shifted window of as many days as its name states. | No |
| R7 | What percentage of added lines of code survived after 7 days. | No |
| R30 | What percentage of added lines of code survived after 30 days. | Yes |
| R90 | What percentage of added lines of code survived after 90 days. | No |
Work Dynamics Indexes
| Column | What it shows | Visible by default |
|---|---|---|
| Activity | A composite indicator of the participant's overall activity in this project (0-100%), the average of the four metrics below in the same category. | Yes |
| Presence | What % of business days had any activity. | No |
| Effort | How intensive the work was relative to the assumed target (calories per business day). | No |
| Output level | How regularly increments were produced relative to the assumed target. | No |
| Work Rhythm | How evenly activity was distributed over time, without long gaps or clusters. | No |
| Business Days | The number of business days in the selected period, excluding weekends and holidays. | No |
| Productive Days | The number of business days in which the participant had any activity. | No |
| Days Between Increment | The average number of business days between a participant's consecutive increments. | No |
| Non Productive Days | The number of business days with no activity from the participant. | No |
Calories
| Column | What it shows | Visible by default |
|---|---|---|
| Calories (total) | The sum of the participant's development effort (Calories) in this project, in the selected period. | Yes |
| Daily Calories | The participant's average daily effort in this project. | Yes |
| Calories / Increment | The average number of Calories per increment. | No |
Increments
| Column | What it shows | Visible by default |
|---|---|---|
| Increments (total) | The total number of recorded changes (commits, tickets, etc.) by the participant in this project. | Yes |
| Daily Increments | The participant's average daily number of increments in this project. | Yes |
→ Calories, Increments and Lines