Worklogs
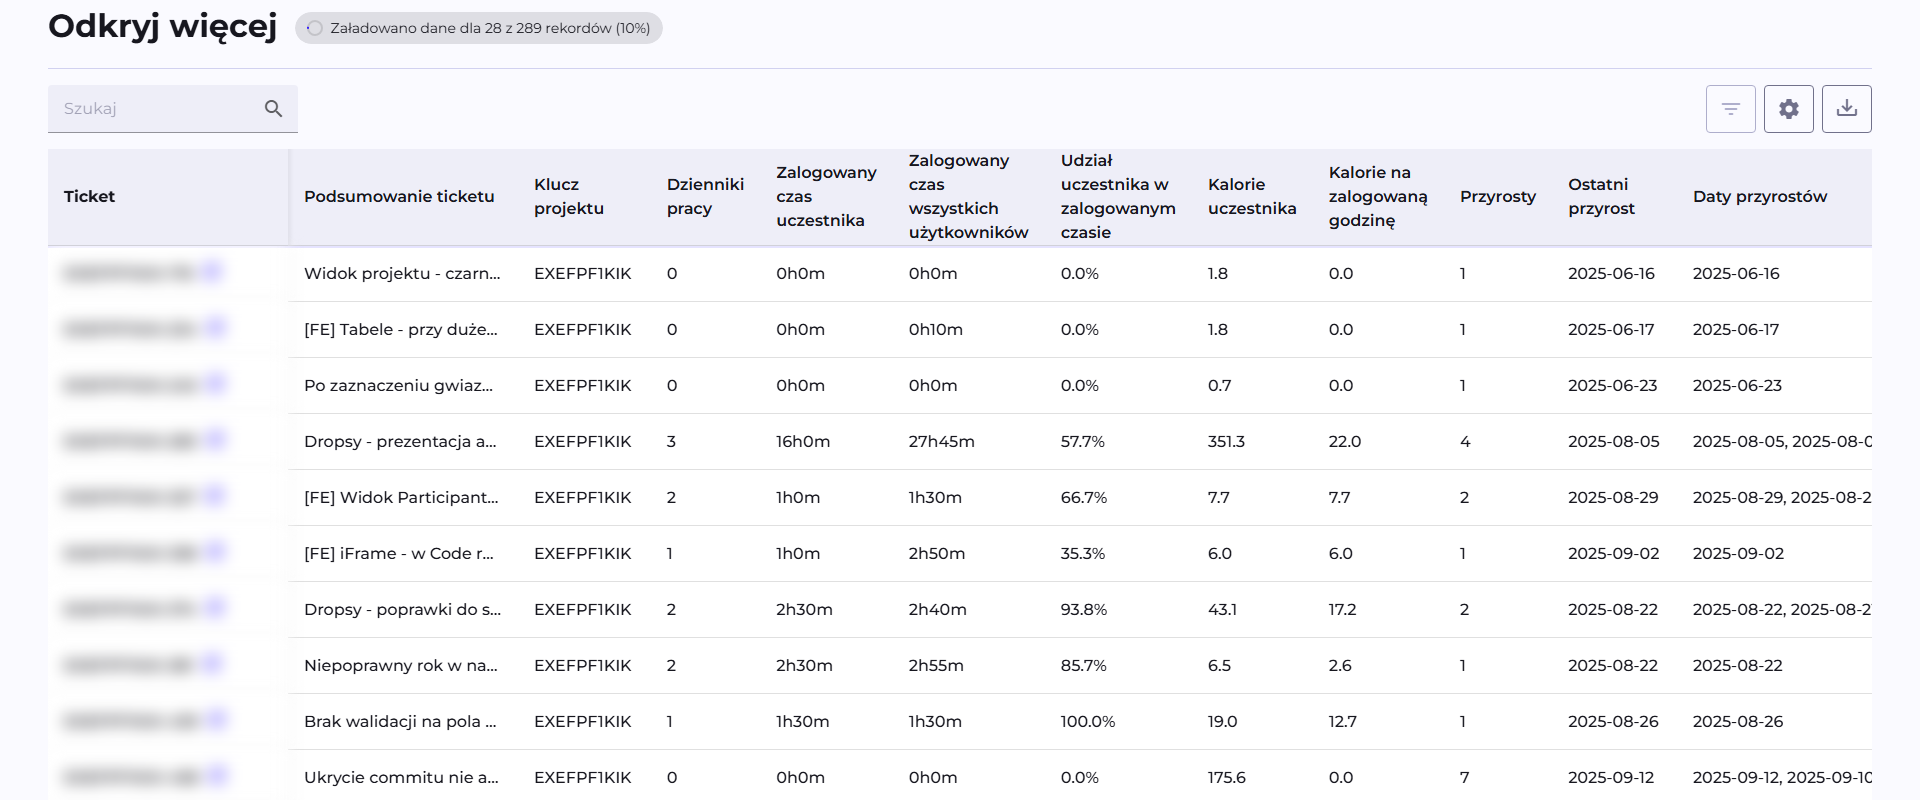
The table in the "Discover more" section sets a participant's Calories generated on a given ticket against the time they logged in Jira/Tempo. Visible on the Participant page, it requires a configured Jira and Tempo integration, because it fetches worklogs authored by Tempo.
Columns
| Column | What it shows |
|---|---|
| Ticket | Ticket identifier. |
| Ticket Summary | The ticket's title from Jira. |
| Project Key | The project's prefix/key in Jira. |
| Worklogs | Number of separate time entries (worklogs) logged by the participant on this ticket. |
| Participant's Logged Time | Total time logged by this participant on this ticket. |
| All Users Logged Time | Total time logged by everyone on this ticket. |
| Participant's Share Of Logged Time | Participant's logged time ÷ all users' logged time. |
| Participant's Calories | Sum of the participant's Calories from commits linked to this ticket. |
| Calories per Logged Hour | Participant's Calories ÷ participant's logged time (in hours). |
| Increments | Number of the participant's increments linked to this ticket. |
Calories are calculated from commits, the same as everywhere else in Q247. Time logged in Jira/Tempo is a separate, external data source, only set alongside it in the same table.
They are linked by the ticket key read from the commit message: the Calories of a participant's commits whose message contains that key are added to the given ticket. A commit without a key counts toward the participant's metrics, but will not end up in any row of this table, and the recommended message format is described in Additional rules.
The table sets two independent data sources about the same ticket side by side: what was produced in code (Calories) and how much time someone declared in Jira/Tempo (Logged time). A low Calories per Logged Hour value on a given ticket does not have to mean low productivity: it can just as well point to time spent on something that leaves no trace in commits (analysis, meetings, manual testing), logged against that same ticket nonetheless. Conversely, a very high value can point to underreported time logging, not exceptional efficiency.
Participant's Share Of Logged Time shows whether a given ticket was the work of one person or shared among several: a low share with many participants on a given ticket is a normal picture of teamwork (code review, pairing), not a sign of a problem.
Loading data
Data loads in batches in the background; the counter next to the section title shows the progress ("Loaded data for X of Y records").
Worklogs are fetched from Jira on demand, one request per ticket, so the loading time depends on the number of the participant's tickets and on Jira's own response time. With a larger number of tickets, fully loading the table can take even a few minutes. The section can be left open in the meantime and revisited later, and worklogs once fetched are cached, so opening the same participant again works faster.