Health Check (project and team health metrics)
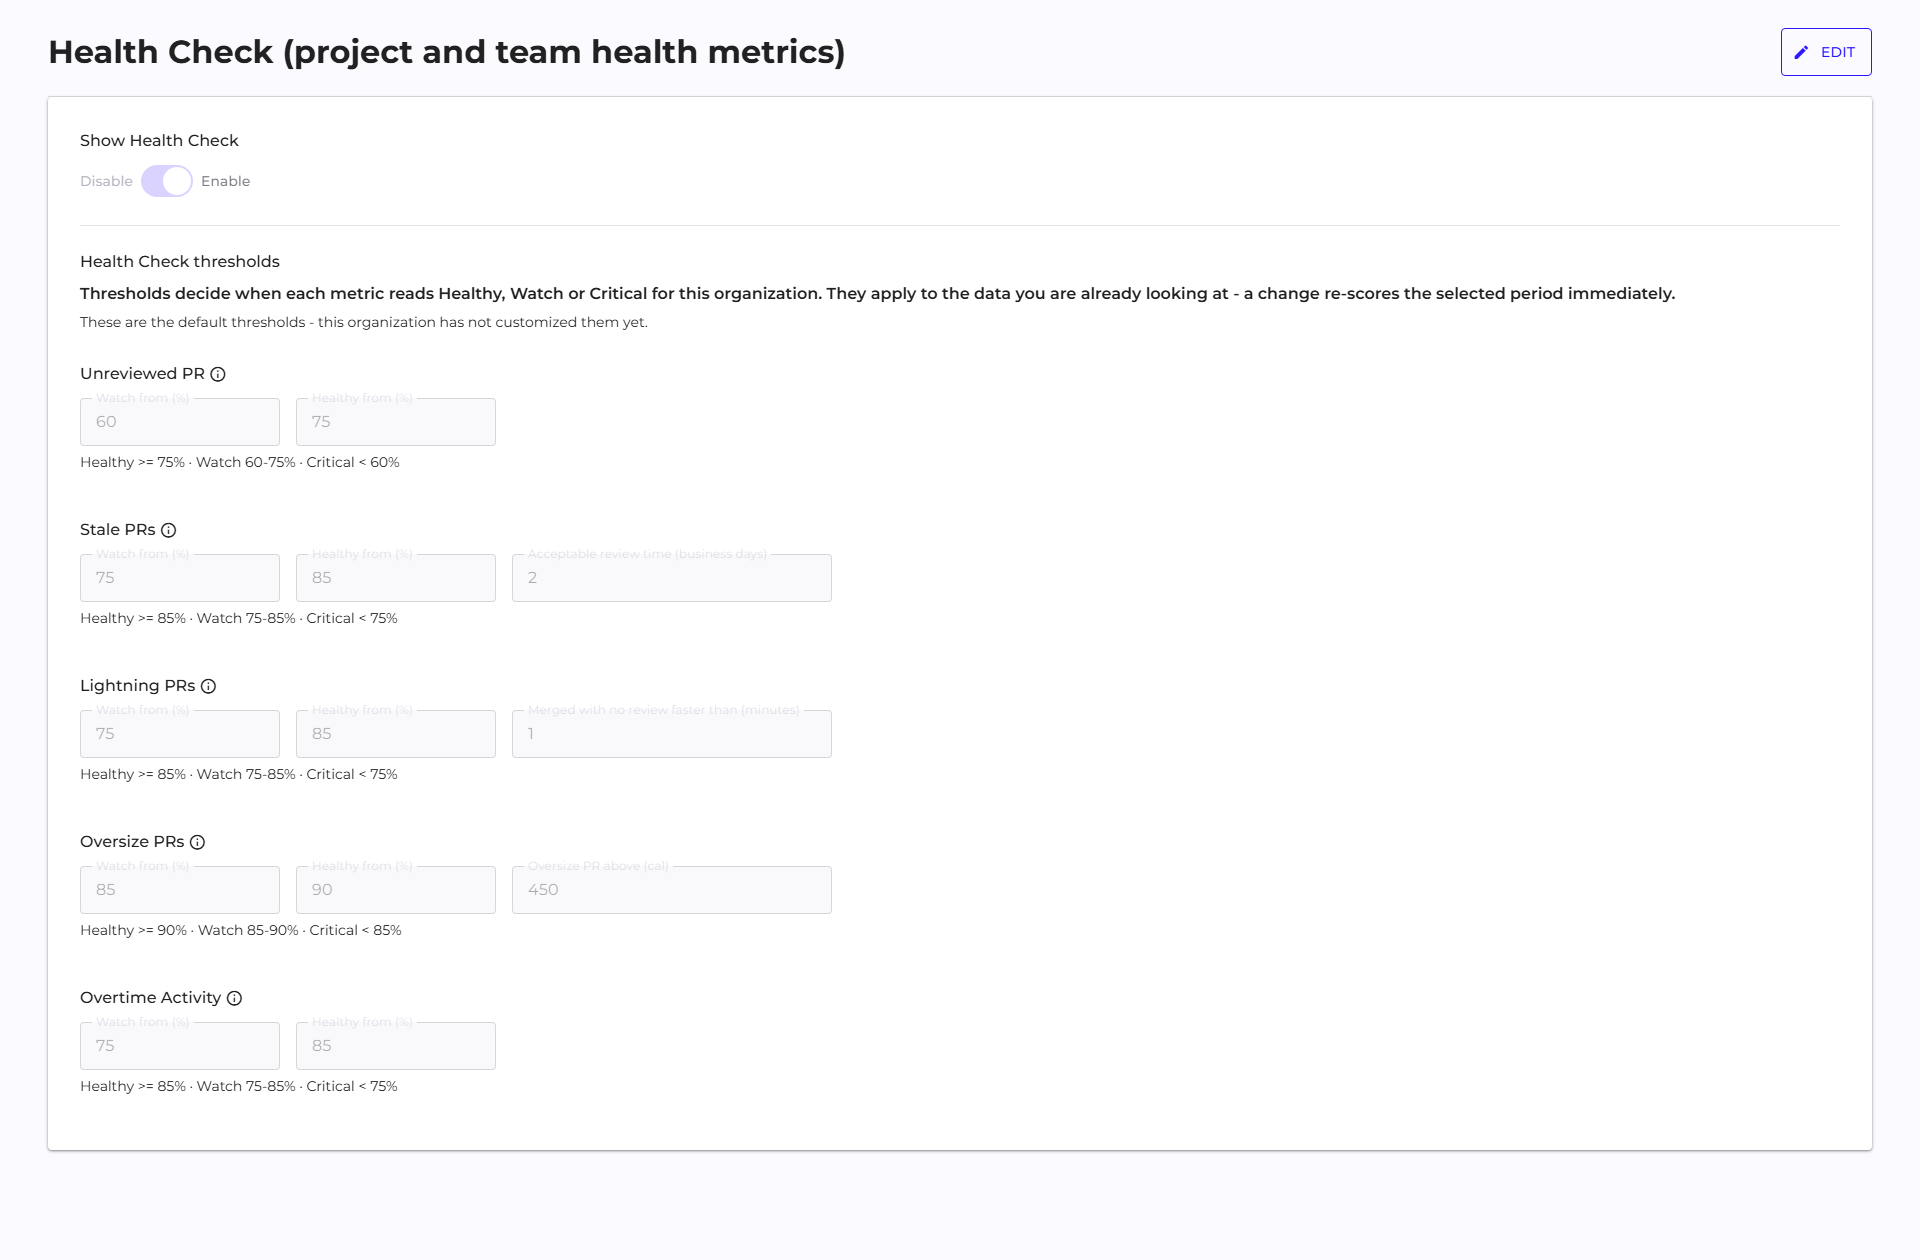
The section is named "Health Check (project and team health metrics)" in the interface, and it sets the thresholds that health scores across all views depend on.
The description of the metrics themselves, their definitions and how the node score is calculated are on the Health Metrics page.
The section is visible only to accounts with the organizational Admin role, described in Permissions.
Enabling the feature
The Show Health Check toggle, with its Disable and Enable positions, decides whether the health sections appear on the Overview and on Teams, and whether health pills are visible in the headers of project and team pages.
Besides this toggle, two more things are needed: the feature has to be made available to the organization, and the Enterprise Plugin has to be in version q247-enterprise-plugin-linux-v2.4.2 or newer. An older plugin does not deliver the data these metrics are calculated from.
The toggle can be saved without touching the thresholds. The organization then runs on the default values.
Threshold fields
The thresholds sit in a block titled Health Check thresholds, one row per metric.
| Field | What it concerns | Default |
|---|---|---|
| Watch from (%) | the lower bound of the Watch state, below which the Critical state begins | 60.0 to 85.0 depending on the metric |
| Healthy from (%) | the lower bound of the Healthy state, separate for each metric | 75.0 to 90.0 depending on the metric |
| Acceptable review time (business days) | the threshold for the Stale PRs metric | 2 |
| Merged with no review faster than (minutes) | the threshold for the Lightning PRs metric | 1 |
| Oversize PR above (cal) | the threshold for the Oversize PRs metric | 450 |
The first two fields repeat for each of the five metrics. The next three belong to individual metrics and set the boundary beyond which an event stops falling within the norm.
The default values for the individual metrics are listed in the table on the Health Metrics page.
The Watch threshold has to be lower than the Healthy threshold. The reverse order blocks saving the whole section, including the other metrics.
The Cancel button restores the state from before entering edit mode. An organization that set its own values keeps them even when the product's default values change.
Distribution charts in edit mode
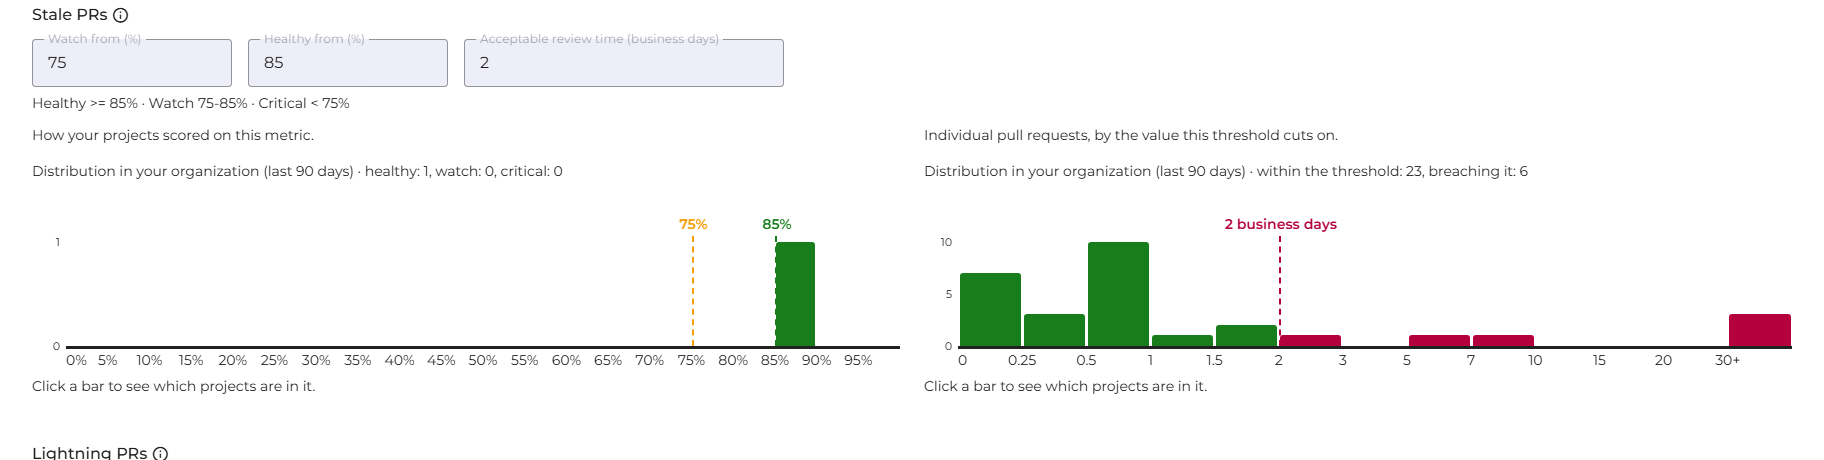
Histograms appear only after entering edit mode and disappear after saving or canceling. They show how the threshold being set splits the organization's real data, so you can see how many projects will cross to the other side of the boundary before confirming the change.
The chart on the left is present for every metric. It shows the distribution of projects by that metric's value, with markers for both percentage thresholds. Clicking a bar shows the contents of the bucket, meaning the health value of the individual projects.
The chart on the right is present only for the three metrics that have their own value threshold: Oversize PRs, Stale PRs and Lightning PRs. It shows the distribution of individual pull requests relative to that threshold, and clicking a bar gives the number of pull requests in the project. The Unreviewed PR and Overtime Activity metrics have only the left chart, because they have no value threshold.
Threshold markers move on the chart with every keystroke, while the numbers in the caption below the chart catch up from the server with a delay. The mismatch between the two while typing a value is normal and disappears after a moment.
Data window on the charts
Histograms are always calculated from the last 90 days. This value is fixed and does not depend on the organization's settings or on the date range selected elsewhere in the application. Manage Organization has no date range selector on the top bar anyway.
The distribution on the chart is for choosing a threshold. The organization's current health is shown by the health summary section on the Overview.
Excluding individual repositories
The thresholds in this section apply to the whole organization, but a single repository can be excluded from measurement entirely. This is done with the Health Metrics column on the Sources list, with a row action and a bulk action.
An excluded repository does not enter either the numerator or the denominator of any of the five metrics, at any level. This is the right tool for repositories whose way of working does not lend itself to this scoring: generated code, external imports, or archival repositories. Tuning the thresholds for such a case would distort the score of all the other projects.
The exclusion affects health metrics only. The other views and metrics keep showing that data.
Scope of a threshold change
Thresholds apply to the whole organization. They cannot be set separately for a project or a team.
A threshold change also works retroactively: states are recalculated from scratch at the next recalculation, including for dates before the change. Rescanning repositories is not needed for this.
See also
- Health Metrics: the definitions of the five metrics and how the score is calculated
- Work calendar: working hours and holidays, which Overtime Activity is based on
- Sources: excluding individual repositories from measurement