Version v2.6.1

Version 2.6.1 continues the development of the workflow metrics introduced in the previous release. Statistics on project, team, and participant cards have a new look and now show the change in value compared to the previous period. We have added new metrics describing the pace of task completion, the number of tasks in progress, and the distribution of work types, available at the project and participant level. This release also includes visual improvements in several views and stability fixes.
Below you will find a detailed description of the most important changes.
New Features
New Statistics Design Showing Value Change
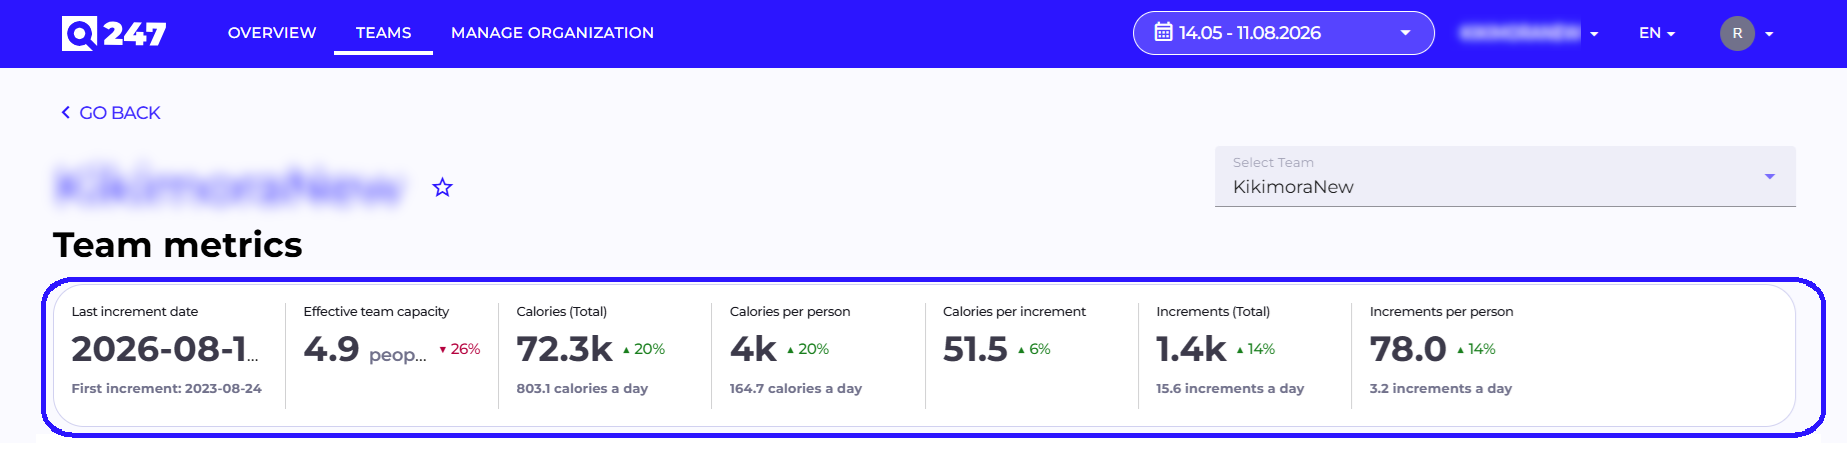
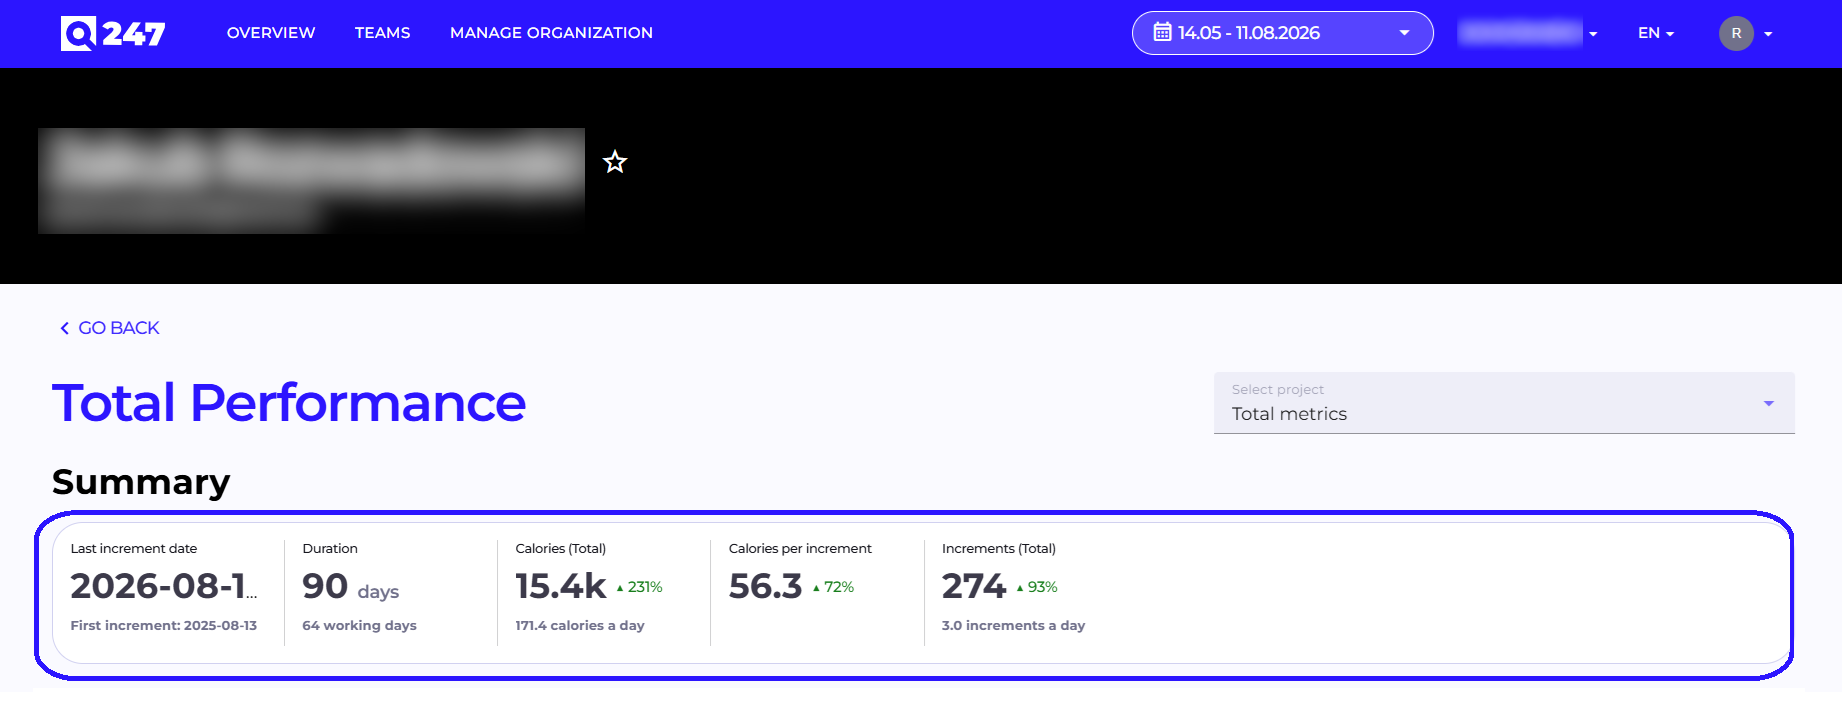
Statistics on the Project, Team, and Participant views have a new, unified look. Each metric card now shows the change in value compared to the previous period of the same length, so you can see at a glance whether a result is going up or down, without additional comparisons. This makes it easier to spot a trend quickly, for example whether the team's pace of work in the last month is better than the month before. The change applies to how existing metrics such as calories, increments, lead time, and cycle time are presented, not to how they are calculated.
New Pace and Work Type Metrics
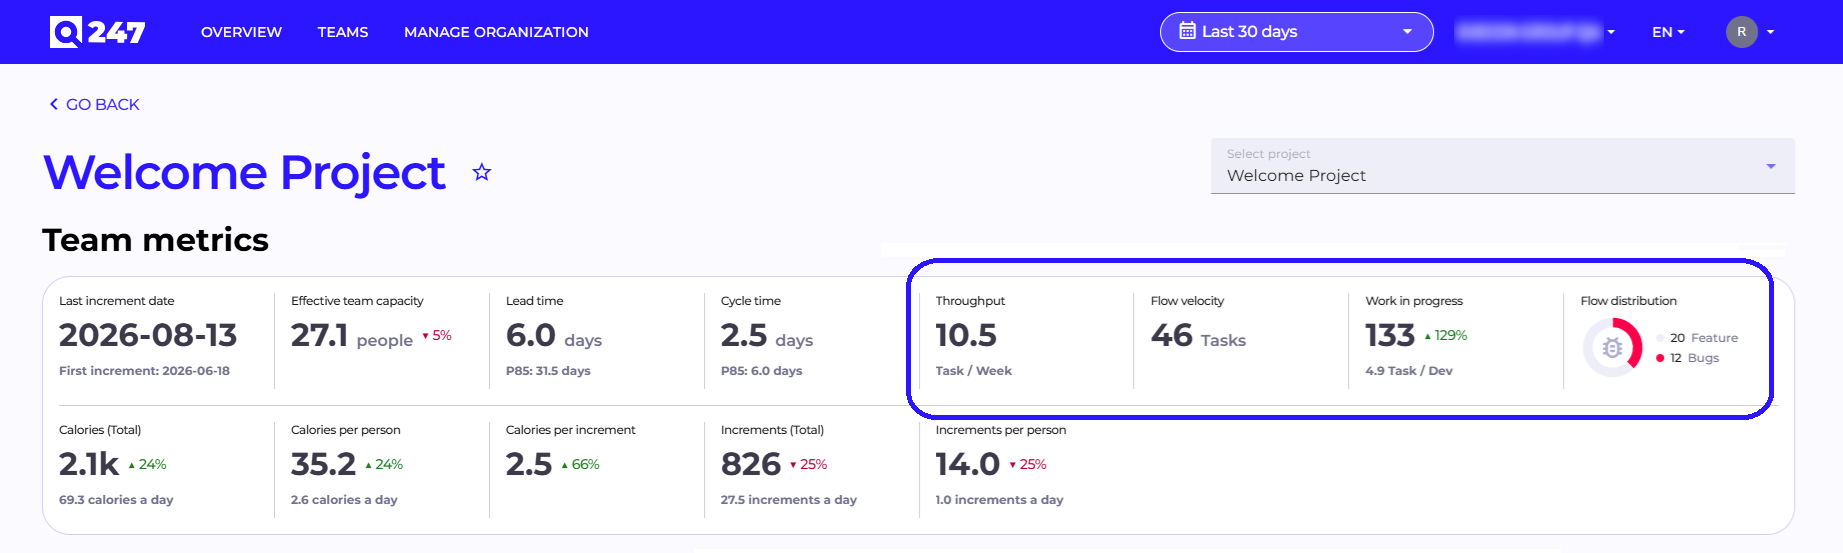
A new group of indicators has been added to the workflow metrics, visible on the project card:
- task completion pace, i.e. the number of tasks completed per week,
- the total number of tasks completed in the selected period,
- the number of tasks in progress at the end of the period, including per developer,
- the distribution of completed tasks by type, for example features and bugs (the type breakdown can be customized in the organization and project configuration).
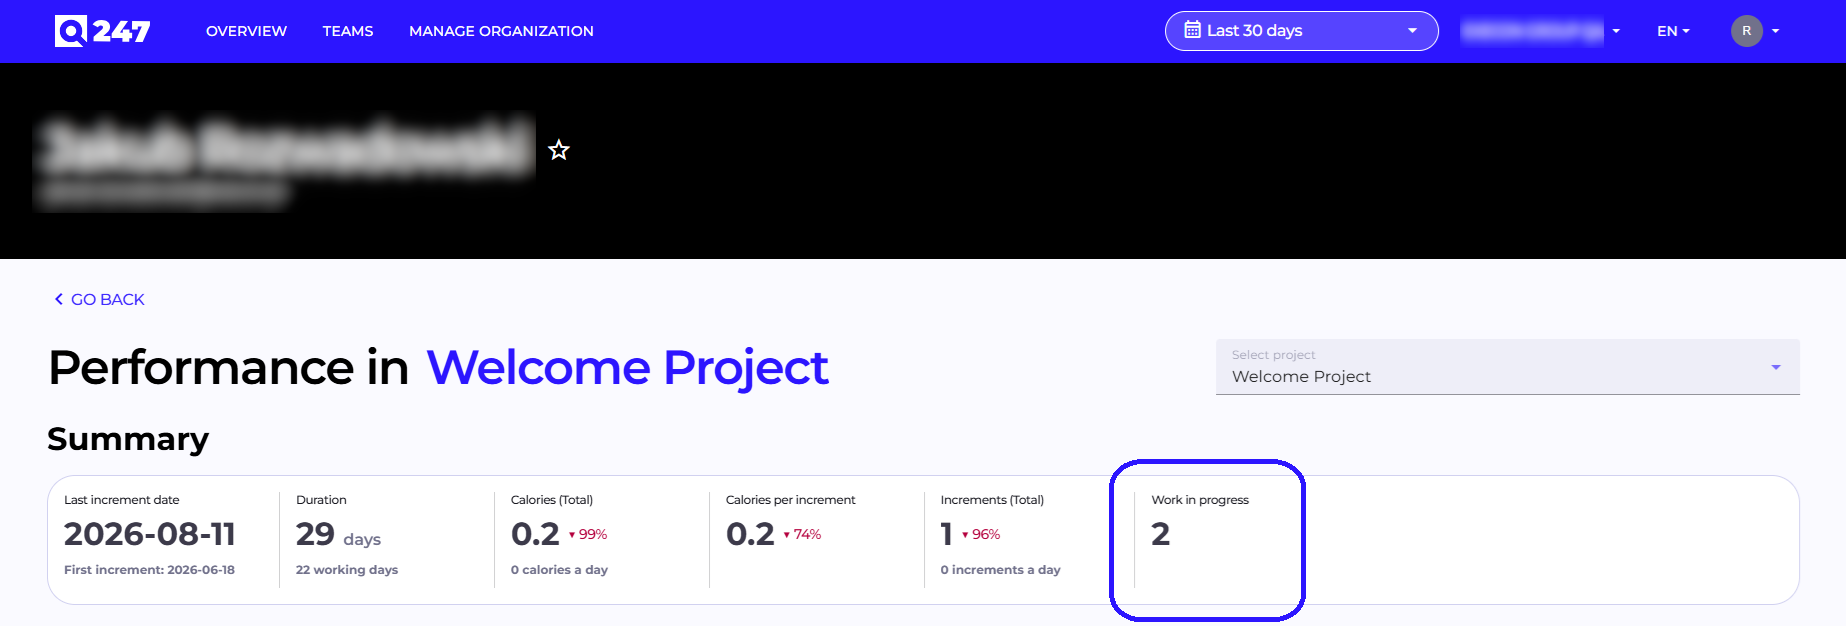
The participant card shows the number of tasks in progress at the end of the period. All the new indicators respond to the selected date range and show the change compared to the previous period. We also clarified the messages shown when workflow metrics are not yet available for a given project, for example because no ticketing system is connected.
Improvements
The Delivery Tracker chart now behaves more predictably. The legend shows the correct participant names, the averaging filter only applies to the selected people, and selected data series no longer reset after switching tabs.
Several visual issues were fixed across the application. In the AI Adoption view, bar scaling and how data is displayed in charts and labels were unified. In the Workload view, navigation to participant details and spacing between elements were fixed.
Performance and Stability
Improved the stability of organization configuration and of processing data coming in from source systems.