Version v2.6.2

Version 2.6.2 focuses on performance and stability. Analytical views load faster, and charts and participant selection work smoothly even in teams with thousands of people. This release also starts collecting data for team and project health metrics (Health Metrics), whose views we will make available in the next release.
Below you will find a detailed description of the most important changes.
Performance and Stability
Faster Data Loading in Analytical Views
We optimized data loading on the Overview page and in analytical views. Depending on the view, load times are now more than twice as fast, which is most noticeable in large organizations with over 1,500 projects. The values shown remain unchanged. We will extend this optimization to further dashboards in upcoming releases.
Charts and Participant Selection in Large Teams
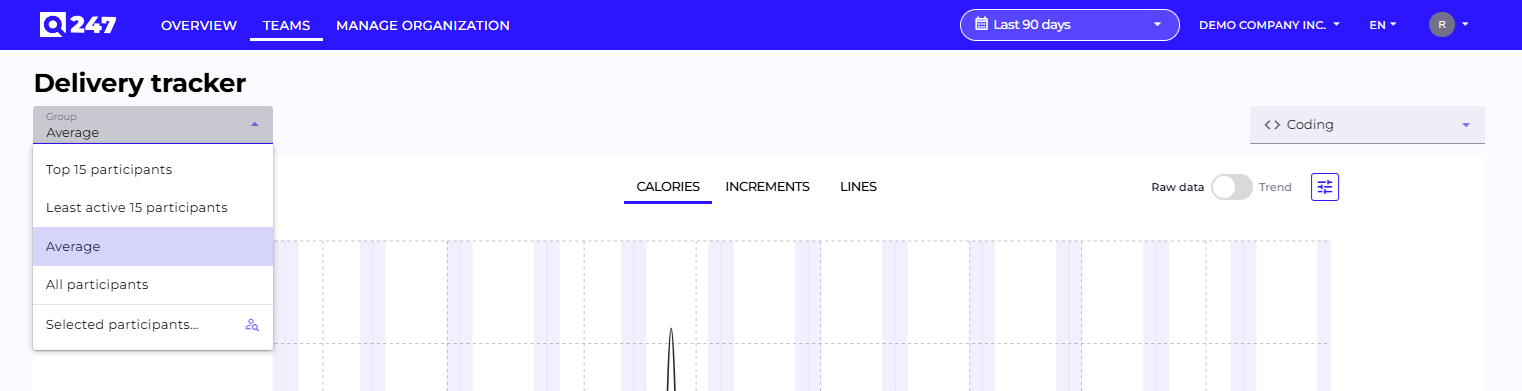
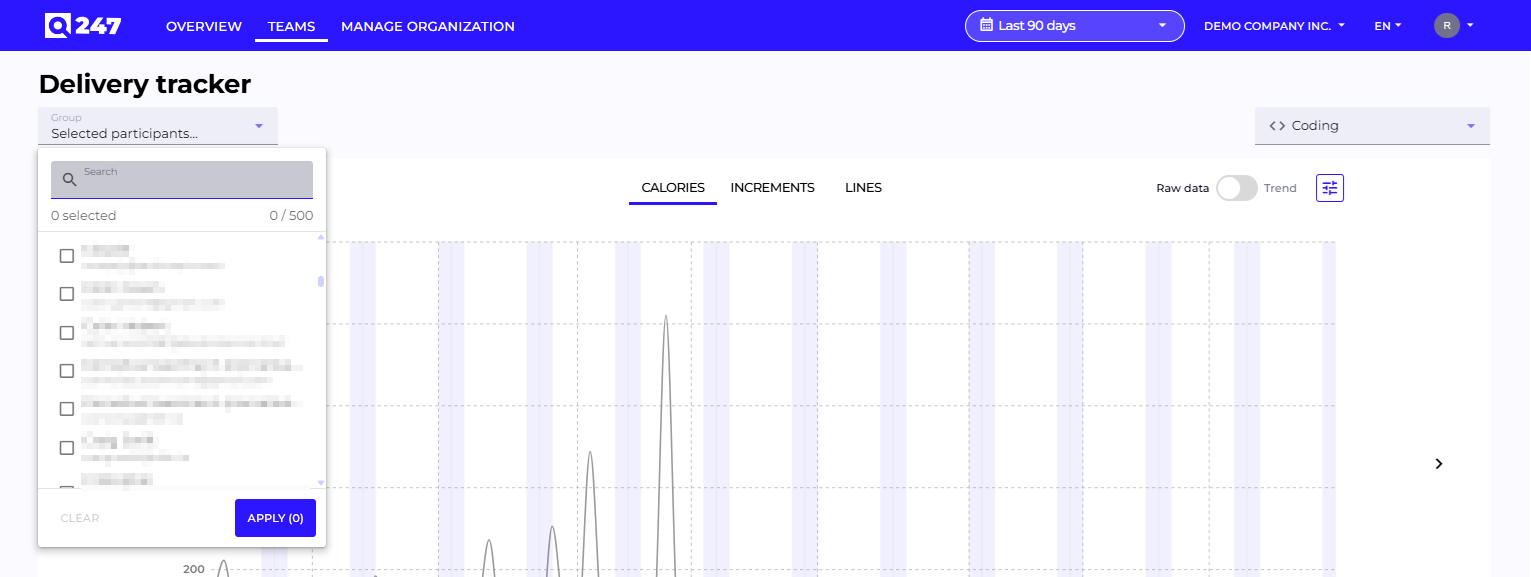
You can now freely choose which people from a project's team are shown on a chart. The selection is made from a dropdown that defines the chart's content, and it now works smoothly even in teams with several thousand people. The increment details window also opens faster.
Rebuilt Interface Error Handling
We rebuilt error handling on the interface side to reduce situations where a single error disables the whole application. Instead of a blank screen, the user now gets a message and can keep working in the rest of the view. This also applies to the Overview page, which previously stopped working when AI adoption data failed to load.
Faster AI Assistant Response to the First Question
The first question in a session used to take noticeably longer to answer than subsequent ones. Response time is back to its previous level.
New Features
Team and Project Health Metrics (Health Metrics)
We are introducing a data and calculation layer for a new group of indicators describing the health of team and project work. These indicators answer the question of whether the way code work is done creates a risk to quality and delivery pace.
We have prepared five indicators:
- the share of work done within the working hours configured for the organization, which signals a risk of team overload,
- the share of changes merged without review,
- the share of changes waiting for review longer than the accepted threshold,
- the share of changes merged so quickly that a review was not realistically possible,
- the share of effort passing through changes too large to be reliably reviewed.
We collect data on changes submitted for review from GitLab, GitHub, Bitbucket, Gerrit, and Azure DevOps, in both cloud and self-hosted versions. No code or review comment content reaches the platform, and data collection turns on automatically when a repository connection is added.
We will make views with these indicators available in the next release, but data collection starts now. You will see results immediately, together with the history from this period, without waiting for the database to fill up. Data collection requires updating the plugin to the version shipped with this release.
Automatic Scanning of New Repositories
Once this option is enabled, the system detects new repositories it has access to every day and brings them into analysis without manual configuration. Two modes are available: adding all new repositories to the welcome project, or creating a separate project named after the repository for each one.
Improvements
Statistics During Data Recalculation
Statistical data is recalculated periodically in the background. The view now shows the previous values until the new ones are ready.
Ingesting Data from Source Systems
An unusual participant identifier in an event batch no longer stops the rest of the users from that same batch from being created. Azure DevOps repositories whose project name contains spaces are now also handled correctly.
Other Changes
- The project view presents Project Managers as plain text instead of chips.
- Charts show participant first and last names in the legend and in the increment details window. The detail data comes from the same source as the chart.
- Changing the interface language happens without reloading the page.
- In organization management, time zone names are translated, and the default time zone is the same across all views.
- Sorting the list in AI Adoption now covers the entire data set.
- The last scan date column in the Sources view shows the current value even after data collection is restarted.
- Form fields no longer show irrelevant browser autocomplete suggestions.