Jira
The Jira integration gives Q247 access to the history of ticket status changes. Flow Metrics are calculated from it, that is Lead Time, Cycle Time and flow distribution. Jira also appears as a source type in the Sources list, assigned to a Q247 project by Jira project key.
Without this integration the whole Flow Metrics group stays unavailable, because Q247 has no way to obtain the moments a ticket moves between statuses.
The data path to Q247
Ticket data reaches Q247 through one of two paths, depending on the selected ingestion method: event by event, through webhooks from Jira to the Enterprise Plugin, or on a schedule, with the plugin polling the Jira REST API.
Both paths score the same ticket fields with the same model. They differ in the direction of the connection and in what has to be configured on the Jira side. In webhook mode, as long as the webhooks do not work, the integration delivers no ticket data at all.
The plugin lets through exactly three events and rejects all the others:
| Event | What it covers |
|---|---|
jira:issue_created | creating a ticket |
jira:issue_updated | changing a ticket, including adding a comment |
jira:issue_deleted | deleting a ticket |
The plugin scores changes in three ticket fields: title, description and status. Calories therefore come from title and description edits and from status changes. A change to any other field, for example the assignee alone or a custom field, gives no Calories.
The Lead Time and Cycle Time boundaries are resolved by querying the Jira API for the list of statuses and their categories. A connector with a correct webhook but an invalid token accepts the events and still counts the metrics wrong, because instead of status categories it matches the boundaries by status names rather than by their categories.
Cloud and On-Premise
Both variants deliver data through the same mechanism and the same webhook route. They differ in two things: where the event receiver stands and what has to be done on the Atlassian side.
| Variant | Webhook receiver | Action on the Atlassian side |
|---|---|---|
| Jira Cloud | an address on the Q247 side, the Client does not provide it | installing the Q247 app in the Atlassian site and pasting the API key into it |
| Jira On-Premise | the Client plugin, at the address given in the form | manual webhook registration in the Jira instance |
In Q247 forms the variants are named "Jira Cloud" and "Jira On-Premise". The On-Premise variant covers the instance that Atlassian calls Jira Data Center.
Data available after activation
Once the integration runs, the following appear:
- Flow Metrics on the project dashboard: Lead Time, Cycle Time, flow distribution into Features and Bugs.
- A source of the Jira type in the Sources list, assignable to a Q247 project by project key.
- A ticket calorie score, calculated locally by the plugin from the ticket content.
- Worklogs in the participant view, if the Tempo integration is enabled.
Q247 receives current ticket events from the moment the integration starts working, regardless of the ingestion method. Metrics are calculated incrementally: they grow together with the number of collected events instead of appearing in full form right away.
Without historical data backfill this has practical consequences for the first few weeks. A ticket opened before the integration was activated and completed after it enters Lead Time, but may not enter Cycle Time if the integration did not register the ticket moving into work. A reliable picture of the flow appears after one full work cycle of the team, usually after two or three sprints. Retrieving data from the period before activation is described in → Historical data backfill.
Prerequisites
Before you enter the connector form you need to have the following ready:
- A service account in Jira with the Browse Projects permission on all projects covered by the integration. Without it the plugin will not read the tickets or their history.
- An API token generated on that account. The paths differ between variants, see API tokens below.
- Jira administrator access, in webhook mode only. It is needed once and not necessarily from the same person: to install the Q247 app (Cloud) or to register the webhook (On-Premise).
- The Q247 app installed in the Atlassian site, in webhook mode and for the Cloud variant only. The Execon administrator provides the installation link, the app is not public in the Atlassian Marketplace.
- The Q247 plugin running and visible in Configuration, the one the connector will be assigned to, with Jira support enabled. The Q247 deployment team configures it, see Enterprise Plugin installation.
Network traffic
The direction of communication with Jira depends on the ingestion method. In both modes the plugin queries the Jira API for tickets and statuses, and for worklogs as well when the Tempo integration is enabled. In webhook mode the communication is bidirectional, because Jira in the other direction sends webhooks to the event receiver. The deployment variant decides where that receiver stands, and therefore whether incoming traffic concerns the Client network. In API polling mode no inbound connection to the plugin is needed.
| Connection | Direction | Required |
|---|---|---|
| Plugin → Jira (reading tickets, statuses, worklogs) | outgoing from the Client | yes |
| Plugin → Q247 (sending results) | outgoing from the Client | yes |
| Jira Cloud → Q247 receiver (webhooks) | from Atlassian to Q247 | yes, in webhook mode |
| Jira On-Premise → Client plugin (webhooks) | incoming to the Client network | yes, in webhook mode and in this variant |
Network settings for webhooks apply only in webhook mode and depend on the variant. In the Cloud variant webhooks go to an address on the Q247 side, so the Client opens no port of its own and keeps no allowlist of addresses on the Atlassian side. In the On-Premise variant the Jira instance has to reach the plugin. The plugin starts only one listener. It first tries HTTPS on the configured port, 443 by default. If HTTPS cannot start, it starts HTTP on the port configured for HTTP, 80 by default. Allow the port on which it is actually running. Port selection and configuration are described under Network access.
API tokens
| Variant | Path to generate the token |
|---|---|
| Atlassian Cloud | account avatar → Account Settings → Security → Create and manage API tokens → Create API token. Give it a name and set an expiry date. |
| Jira Data Center | account avatar → Profile → Personal Access Tokens → Create token. Give it a name and clear the automatic expiry option. |
| Tempo (Cloud) | Apps → Tempo → Settings → API Integration → New token. |
The full, current paths are described in the Atlassian documentation; we give them here in brief, because Atlassian changes its UI independently of us.
A token generated in Atlassian Cloud serves Jira and Confluence at the same time. If you configure both integrations, generate it once and use it in both connectors.
Credentials from environment variables
Instead of typing credentials in directly, you can put the name of an environment variable with the $$ prefix in the field. The plugin reads it from its own environment at the moment it connects to Jira, and only the variable name is stored in the Q247 database.
Both credential fields are supported, and independently of each other:
| Form field | Value in the form | Variable on the plugin host |
|---|---|---|
| Account Email (Cloud) or API Username (On-Premise) | $$JIRA_USER | JIRA_USER=q247-service@company.com |
| API Token | $$JIRA_TOKEN | JIRA_TOKEN=ATATT3xFfGF0... |
| Tempo API Token | $$TEMPO_TOKEN | TEMPO_TOKEN=... |
The Tempo credentials section uses the same mechanism, so the Tempo token can also be kept outside the panel.
The full description of the syntax, the security consequences and the typical error with an unset variable is in Connectors. The prefix is exactly two dollar signs, the variable has to exist on the plugin host, and its absence surfaces only as failed authentication on the first connection, with no error at the save stage.
Ingestion method
The Jira connector pulls data in one of two ways. The choice sits in the connector form, in the Ingestion method option group, with two positions:
| Position | How it works |
|---|---|
| Webhook - Jira pushes events to the plugin | Jira itself sends events to the Enterprise Plugin, through a Data Center webhook or through the Q247 app for Atlassian |
| API polling - the plugin reads Jira on a schedule | The Enterprise Plugin itself reads the change history and comments through the Jira REST API, on a schedule |
On both paths the same model calculates Calories, from the same scored ticket fields. The event time in Q247 corresponds to the moment of the action in Jira, not the moment the data was retrieved, so in both modes an event lands on the chart on the day it happened in Jira.
The set of recorded events does differ in detail between the modes, however. API mode sees an edited comment only in its current content, and detects a ticket deletion only in the daily run. Calories for the same period may therefore differ depending on the mode.
Reasons to choose API mode
API polling requires no inbound connection to the plugin at all, so the entire webhook configuration on the Jira side disappears, along with the requirement that the Jira instance be able to see the plugin's address. In this mode, steps 2a and 2b below are unnecessary.
API mode also tracks tickets by their identifier, so moving a ticket to another project or changing its key does not lose history.
API mode settings
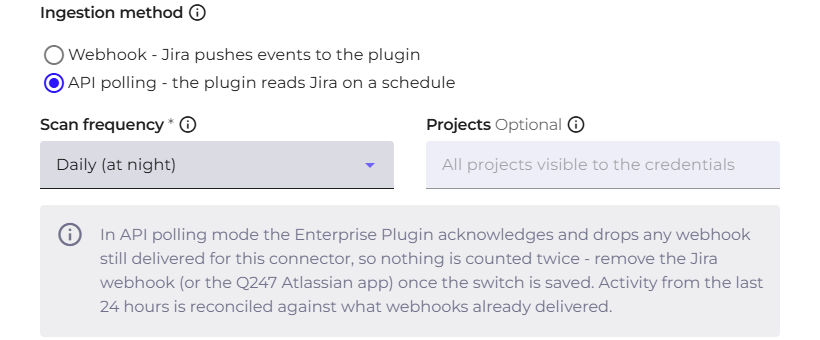
| Field | What it does |
|---|---|
| Scan frequency | Daily (at night) or Hourly. Daily mode runs at night, in the plugin host's time zone; hourly mode gives data freshness within an hour |
| Projects | comma-separated Jira project keys to poll, for example PRA, PRB. An empty field means all projects visible to the given credentials |
The project list replaces the previous one when saved, so it does not append to what was there before.
Credentials depend on the instance variant. Jira Data Center authenticates with a personal access token, Jira Cloud with the account email address together with an API token. Saving without the instance address or without the token is blocked with the message Please provide Jira Base URL or Please provide API Token.
Switching from webhooks to API mode
Two things happen when you switch, both worth noting before you make the change:
- Activity from the last 24 hours is reconciled against what the webhooks already delivered. No gap or duplicate is created at the point where the two modes meet.
- Remove the Jira webhook once the change is saved, along with the Q247 app for Atlassian, if it was used. The plugin accepts and drops any webhooks still delivered for this connector, so nothing is counted twice, but the webhook itself stays needlessly active.
Switching the other way, from API mode back to webhooks, works on the same principle and also does not duplicate data.
API mode diagnostics
There is no dedicated screen for this mode. In the Sources table the Interval and Last data scan columns show "N/A" for Jira in both modes, so they do not confirm that data is being retrieved. The plugin logs and the remaining diagnostic steps are described in Verification and diagnostics.
Historical data backfill
Q247 can retrieve ticket history from the period before the integration was activated: comments, title and description edits, and status changes. The Enterprise Plugin reads it through the Jira API and scores it by the same rules as current data. The backfilled data feeds Calories in the Documentation type, as well as Lead Time and Cycle Time, also for tickets completed before the integration was activated.
The backfill is enabled in the Historical backfill block of the connector form. The Backfill enabled switch is off by default, and the Backfill window (days) field is then inactive and suggests 730 days, that is two years. With the switch on, the field accepts a whole number from 1 to 7300.

The Backfill window (days) field sets the scope: the number of days back that the backfill covers. The ticket creation date decides whether a ticket falls within the window. A ticket created before the window boundary is not included, even if it was closed inside the window.
Two more things are needed besides the window setting: the feature must be made available to the organization, and the Enterprise Plugin must be version q247-enterprise-plugin-linux-v2.6.0 or newer.
The backfill works with both ingestion methods, webhook and API polling. Runs take place at night, in the plugin host's time zone. A large window is completed over subsequent nights, and each run starts where the previous one stopped. Increasing the window later covers only the added range.
Backfilled events are subject to the Hide increments above threshold in the same way as the other Jira data. How the threshold works is described in → Increment visibility.
The backfill does not restore deleted tickets and comments, and a comment edited after it was added reaches Q247 in its current content. Calories for a backfilled period may therefore differ from those that live recording would have produced.
Step-by-step setup
1. Creating the connector in Q247
In Configuration, in the Documentation section, next to the Jira entry, the "+" button by the Connectors list opens a two-step form. The first step covers the connection details.
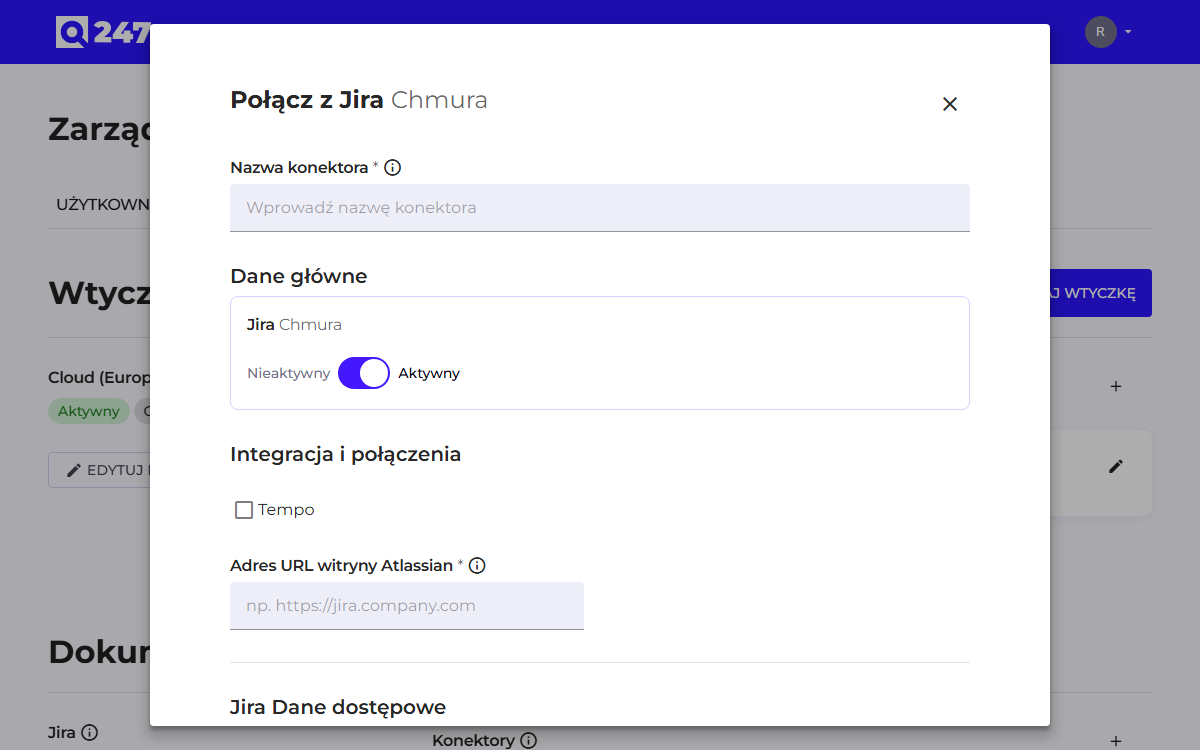
Fields common to both variants:
| Field | What it does | Example |
|---|---|---|
| Connector Name | your own name to recognize it in the list | Jira produkcyjna |
| Main data | the Active/Inactive switch for the whole integration | Active |
| API Token | the service account credential | ATATT3xFfGF0... or $$JIRA_TOKEN |
| Account Email | the address of the account the token was generated on | q247-service@company.com |
Fields for the Cloud variant only:
| Field | What it does | Example |
|---|---|---|
| Atlassian Site URL | the base address of the site in Atlassian Cloud | https://firma.atlassian.net |
| Tempo | a checkbox that reveals the Tempo credential fields | selected when the organization uses Tempo |
Fields for the On-Premise variant only:
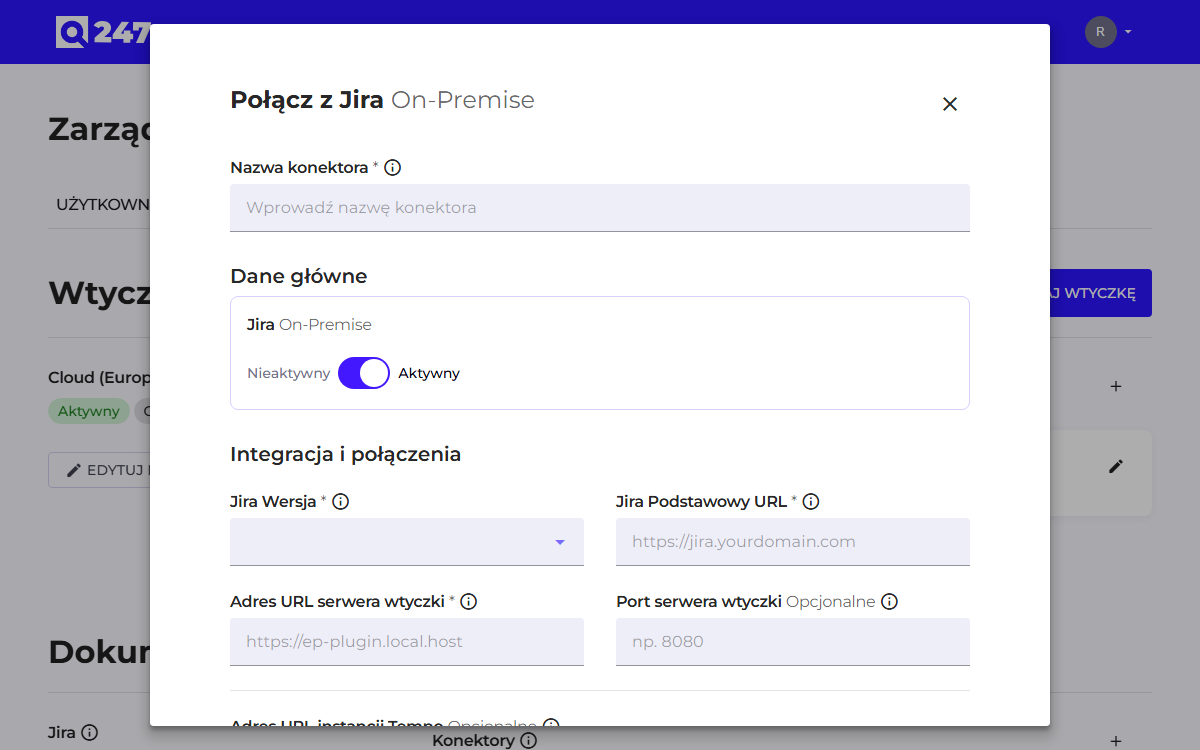
| Field | What it does | Example |
|---|---|---|
| Jira Version | the instance version, picked from a list | 9.15.2 |
| Jira Base URL | the address of the Jira instance | https://jira.company.com |
| Plugin server URL | the address at which Jira will see the plugin | https://ep-plugin.company.com |
| Plugin server Port | the port on which the plugin is actually listening, usually the HTTPS port | 8443 |
| Tempo instance URL | a separate Tempo address, if it differs from the Jira address | https://jira.company.com/rest/tempo-timesheets |
| API Username | the service account login, optional | leave empty with token authentication |
You can check the instance version in Jira: the gear icon, then Apps. A name with a number is displayed, for example "Jira Software 9.15.2".
This field serves only to build the webhook address that you copy and paste into Jira. Q247 never connects to that address, so it does not have to be reachable from the internet. It is enough that the Jira instance reaches it. The value depends on the deployment model: with the plugin in your own infrastructure it is its internal address, with the plugin hosted by Q247 the address points at a Q247 domain.
The "Save Connector" button closes the first step and reveals the second.
2a. Cloud variant: the Q247 app in the Atlassian site
The second step of the form shows the EP Connect API Key field with a "Copy Key" button. This key links the app installed in the Atlassian site with your organization in Q247.
On the Atlassian side, if the app is not installed yet:
- Open the installation link received from the Execon administrator and click Get app.
- In the site selector point at the instance the integration is to work in, and click Install. One link covers Jira and Confluence.
Then connect the app with the organization:
- In Jira go to Apps → (…) → Manage apps → Take me there.
- Find the Q247 app and choose (…) → Configure.
- In the Q247 Cloud API Key field paste the copied key and confirm with the Proceed button.
The second step of the form points to "Settings → Connected Apps". Such a path does not exist in the current Jira UI. The one from the list above, through Manage apps, is the valid one.
2b. On-Premise variant: webhook in the Jira instance
The second step of the form shows the EP Webhook URL field with a "Copy URL" button. That address contains a random key assigned to your organization, so treat it as a secret.
Registration on the Jira side:
- The gear icon, then System.
- In the left panel Advanced → WebHooks.
- The Create a WebHook button.
- Fill in the fields: Name (any descriptive name), Status (leave it Enabled), URL (the address pasted from Q247).
- In the Events section select issue created, updated and deleted. The plugin will reject the remaining events, so selecting them only increases traffic.
- Click Create.
The second step of the Jira On-Premise connector form tells you to go to the Confluence Data Center instance, and the Confluence wizard symmetrically points at Jira. The webhook is registered in the product whose connector you are configuring.
3. Assigning the source to a project
Once the connector is connected the events from Jira already flow, but they have no assignment yet: until you indicate the Jira project keys, all of them land in the Welcome Project that every organization has from the start. The data is therefore collected, only gathered in one place instead of split across the right projects.
Assigning the keys puts this in order going forward. Events recorded earlier stay in the Welcome Project, because assignment to a project is resolved at the moment the event is recorded, as described in Time scope of the rules. It is therefore worth giving the keys right after the connector is started.
You attach the integration with the Assign Source button, available in Sources and in the Sources tab in the project details. In the "Choose a data source" field you point at Jira, and then give the Jira project keys whose events are to land in this Q247 project.
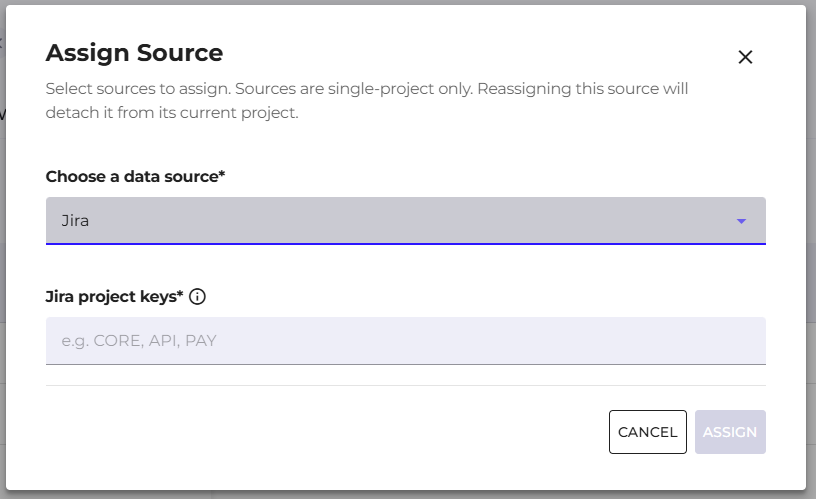
Keys are separated by commas, for example CORE, API, PAY, and accept only capital letters, digits and underscores. One Q247 project can in this way collect events from several Jira keys at once.
The Additional Rules tab in the project details concerns commits, not events from Jira. It assigns a commit to a project based on the ticket key found in the commit, which is useful when one repository serves several business projects. It is described in Additional rules.
4. Tempo worklogs, optional
The selected Tempo checkbox reveals a separate Tempo Credentials section with a Tempo API Token field. In the Cloud variant Tempo requires its own token, generated in Apps → Tempo → Settings → API Integration. In the On-Premise variant the plugin reuses the Jira credentials.
Typing anything there breaks authentication. This applies to the Tempo section only.
Worklogs are fetched on demand, at the moment a user opens the worklogs section in the participant view. Q247 then makes one query per ticket and shows the loading progress, and worklogs fetched once go into a buffer and are not queried again. No schedule is at work here, so the first time the view is opened for a person with many tickets it takes a while.
Only worklogs authored by Tempo are fetched. Native work time logging in Jira Data Center works without Tempo and without this integration.
Logged time comes from Tempo and Calories come from commits, so putting them in one table requires indicating which commit concerns which ticket. Q247 searches for the ticket key in the commit message and it is that key that creates the link: Calories on a given ticket are the sum of Calories of the participant commits whose message contained that ticket key.
One deployment condition follows from this: the team has to record the key in commit messages. A commit without a key is counted normally into the participant metrics, but it will not add up to any ticket, so the table will show logged time without matching Calories. The recommended commit message convention describes how to record the key so that it can be recognized.
Verification and diagnostics
The Status column in the connector list takes one of six values:
| Status | Meaning |
|---|---|
| New | the connector is saved, the plugin has not picked it up yet |
| Pending | the plugin has picked up the connector, the first connection is in progress |
| Ready | the connection is established, no data processed yet |
| Operational | the integration works and delivers data |
| Failed | the last connection attempt did not succeed |
| Archived | the connector is withdrawn from use, historical data stays |
In the Sources table the Interval and Last data scan columns show "N/A" for Jira and Confluence sources, with both ingestion methods, so they are not a way to check whether the integration works.
When data does not appear, check in this order:
- In webhook mode: whether the webhook in Jira is enabled and has the correct address. The address contains the organization key, so a typo produces a rejection with code 401, not an empty result.
- Whether the token has expired. A token with an expiry date set stops working with no message in Q247, and the connector status changes to Failed.
- Whether the service account has access to the project. An account without the browse permission on a given project will read zero tickets, even though the connection itself will be correct.
- Whether the source is assigned to a Q247 project. Without the assignment the data reaches Q247, but has nowhere to show up.
- The plugin logs (
q247-plugin.log) show the received events and sending errors. This is the fastest way to determine whether the problem is on the Jira side or on the Q247 side.
If these points do not point at the cause, report the case to the Q247 deployment team: part of the settings of the plugin that serves the integration are on our side and are not visible in the panel.
Settings that depend on Jira
The connector itself delivers data, but some of the functions calculated from Jira have their own settings elsewhere in the panel. They are gathered below in one place:
| Function | What else to set |
|---|---|
| Lead Time and Cycle Time | the status boundaries in Flow Metrics. The default values, based on the "In Progress" and "Done" categories, work without any change, so you enter that section only when the process in Jira has unusual status categories. |
| Flow distribution into Features and Bugs | assigning ticket type names to two groups, in the same section. Without assigning custom or translated type names some tickets will end up in the "Other" group. |
| Per-project boundaries | the Flow Metrics tab in the project details, when one project has a different process than the rest of the organization. |
| Business days in time metrics | Work calendar, that is the organization time zone and days off. Without holidays filled in, Lead Time and Cycle Time count them as business days. |
| Worklogs | the Tempo section selected in the connector form and the ticket key in commit messages, see Worklogs. |
| Assigning commits by ticket key | Additional rules, when one repository serves several projects. |
| Data from before the integration was activated | the Backfill window (days) field in the connector form, see Historical data backfill. |
| Ticket calorie score | nothing, it counts as soon as the connector starts. |
Scope of processed data
The ticket content, covering the title, description and comments, is analyzed locally by the plugin, the same way as source code in Connectors. What reaches Q247 is the result of that analysis plus the metadata needed for the metrics: the ticket key and type, the URL, the assignee, the status change history together with the moment of each change, and the calorie score. The ticket and comment content itself does not leave the infrastructure the plugin runs in.
The full technical specification together with the list of stored fields is in Enterprise Plugin security.
See also
- Confluence: the second Atlassian integration, the same token, different fields
- Sources: assigning a Jira project key to a Q247 project
- Flow Metrics: what Q247 calculates from the status history
- Enterprise Plugin installation: enabling the Jira add-on and the listening port
- Enterprise Plugin security: the full scope of data exchange