Running code analysis
Below is the sequence of all the steps needed for Q247 to start showing data about code. Configuring the connector by itself is only the first of five steps, and the last two are performed manually, and it is those that most often get skipped.
The symptom of skipping them is always the same, and misleading: the connector shows an Operational status, the repositories are visible, and the dashboards stay empty.
Sequence of steps
| Step | Who does it | How long it takes |
|---|---|---|
| 1. The plugin runs and returns data | deployment team | one-time |
| 2. The connector is connected to the version control system | Q247 administrator | a few minutes |
| 3. Repositories discovered and visible in Sources | automatic | 5 to 10 minutes |
| 4. Repositories assigned to projects together with an interval | Q247 administrator | a few minutes |
| 5. Account statuses set according to who is committing | Q247 administrator | a few minutes plus recalculation |
1. The plugin
The analysis is performed by the Enterprise Plugin, in the Cloud Plugin variant maintained by Q247 or the Private Plugin variant running in the Client's infrastructure. Choosing the variant and installing it is described in Installation.
Before you go further, the deployment has to be visible in Configuration, in the Plugins section.
2. The connector
Add a connector to the version control system, following Connectors. The most important thing at this step: the service account the token was generated on has to have access to all the repositories intended for analysis.
3. Repository discovery
Once the connector is saved, the plugin queries the API and reports the found repositories. Wait 5 to 10 minutes and refresh the page, because the list does not update on its own. The repositories will appear in Sources.
Repositories cannot be added manually from this panel, with the exception of the Generic GIT connector, where the addresses are given directly in the form.
Picking up new repositories automatically
Q247 can check the connected systems daily for new repositories and bring them into the analysis without manual assignment. For recently created organizations this is the default, so step 4 below then applies only to repositories you want to move elsewhere.
A newly discovered repository goes to the welcome project, gets the Operational status and a daily interval, with the time zone taken from the organization's work calendar. A second mode is also available, in which every repository gets its own project named after the repository address.
The mode is set by the Q247 deployment team, in the same way as enabling the plugin's add-ons. In organizations created earlier the feature is off by default and repositories wait for manual assignment.
The mode that creates a project per repository contradicts the recommendation in Rules for grouping repositories below. It can be convenient during a first survey of a large installation, while the links between repositories are still unknown. For day to day work, a split by product works better.
4. Assignment to a project
Scanning only starts once the repository belongs to a Q247 project. From the Sources list you can assign a single repository through the row's actions menu, or select several and use the bulk actions bar.
The assignment form asks for the project and the scan interval:
- Hourly
- Daily, with a choice of time zone. Scanning starts after midnight in the selected zone.
The recommended target interval is Daily. Q247 metrics describe days and weeks, so a daily refresh is fully sufficient, and less frequent scanning saves the load on the plugin and the repository.
At the first startup, though, it is worth choosing the hourly interval, because it lets you confirm within a dozen or so minutes that data is actually being calculated. A daily interval means waiting until the next night, so a possible configuration error surfaces a day later. After the first successful run, switch to daily.
Scanning is incremental: with each subsequent run the plugin goes back two weeks from the last scan, to catch commits that reached the repository late.
Rules for grouping repositories
One repository belongs to exactly one project, but one project can have many repositories. Assigning a repository to another project detaches it from the previous one and moves its entire history along with it; the other consequences of this operation are described in Projects.
Split repositories by business value, not by technology. If a product consists of a backend, a frontend, a mobile app and CI/CD automation, all those repositories belong to a single Q247 project. Splitting one repository into one project fragments the metrics and makes comparisons harder, because the project dashboards stop corresponding to anything that can be set against a plan or a budget.
The one-repository-per-project rule makes sense only when the repositories are genuinely independent products.
5. Account statuses
This step is skipped most often, and without it the other steps produce no effect visible to the user.
People detected during repository scanning get the Other status by default. Accounts with this status are not shown separately in project or team statistics: their activity merges into an aggregate "Others" row, so dashboards look empty even though the commits have been processed.
The target state of the account list is as follows:
| Who | Status | Why |
|---|---|---|
| People currently committing to the repositories | Active (no access), or Active (access) if they are to sign in to Q247 | they are visible as separate participants, with their own metrics |
| People who committed in the past but no longer work on code | Inactive | the account loses the ability to sign in, and the account list corresponds to the current team makeup |
| Technical accounts, bots and integrations | Untracked | their activity does not enter the calculations at all |
The change looks like this:
- Go to Users And Teams.
- Filter the list by the Account Status column, so that only accounts with the Other status remain on it. On a list that is only sorted, the header checkbox would also select accounts with other statuses that landed on the same page.
- Select the accounts individually or with the header checkbox, which selects the rows of the current page. When the list has several pages, repeat this on each of them: selections from successive pages add up.
- From the bulk actions bar, choose the status appropriate for this group.
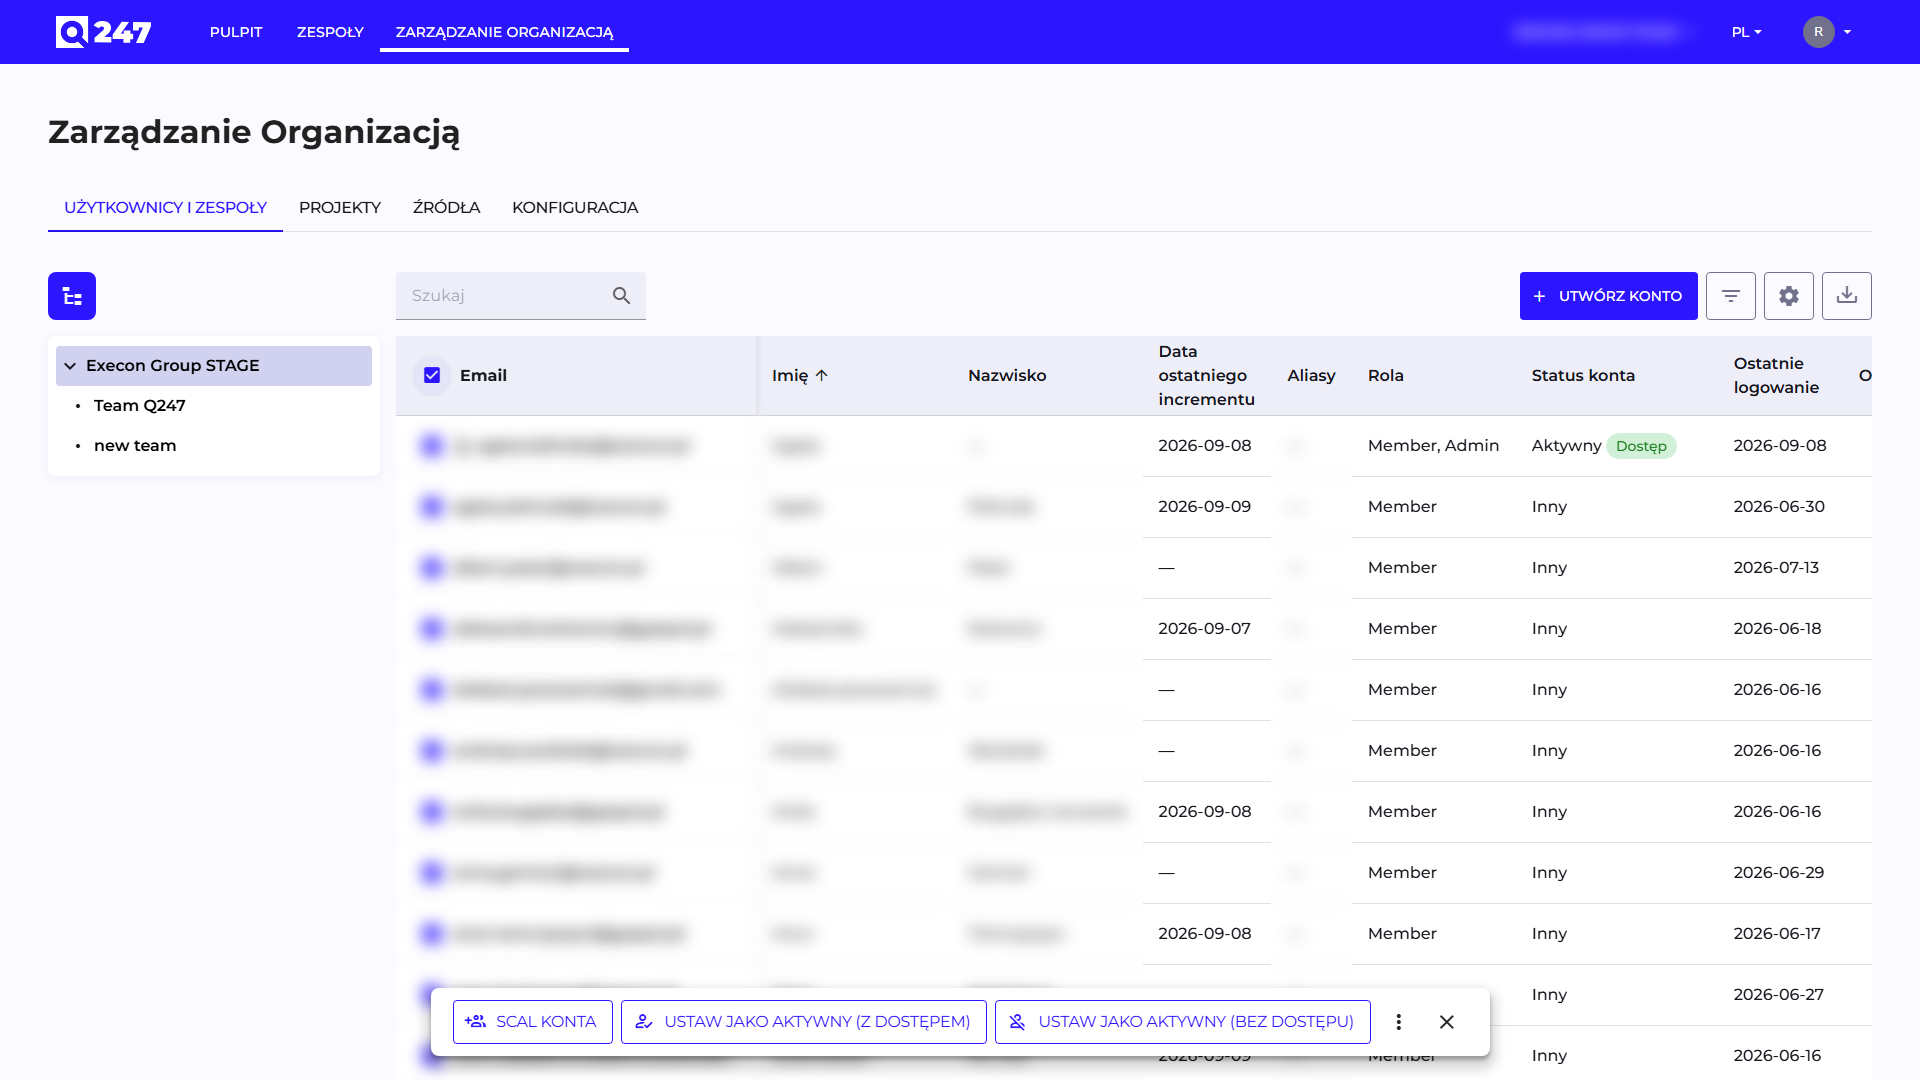
The bar gives three operations directly, and the remaining ones are hidden under the three-dot button, including setting the Untracked and Inactive statuses.
The simplest approach is to split this into two passes: first select all the current contributors and set them to Active (no access), then select the people who have left the team and set them to Inactive. The Last Increment Date column helps identify them.
Every account set to Active, including Active (no access), takes up a seat in the organization's license. → License usage
After the status change, the statistics need to be recalculated, so the data will appear with a delay.
Verification
Check in this order, because each subsequent point only makes sense once the previous one is satisfied:
- The connector status shows Operational.
- Repositories visible on the Sources list.
- The last scan date filled in next to the repository. A "Never" value means scanning has not started yet, most often because of a missing project assignment.
- The project visible on the Overview dashboard.
- People visible in the project statistics, which confirms step 5 has been carried out.
For problems at stages 1 to 3, diagnostics are described on the Connectors page. The plugin logs (q247-plugin.log) show whether data is being sent, and settle on which side to look for the cause.
See also
- Connectors: form fields, token permissions, statuses
- Sources: the list of discovered repositories and operations on them
- Projects: assigning sources from the project's perspective
- Users And Teams: account statuses and bulk operations
- Enterprise Plugin installation: choosing the plugin variant and installing it